
Key Insights
- STRC’s liquidity is deepest exactly when holders least need it. A couple of percent below par, the same size trade moves the price around 4x as much, while a large move in Bitcoin makes far less difference.
- At the peak, more than 25% of STRC’s weekly trading was Strategy buying back its own paper. Close to $1.45b spent in all.
- A $50m position exits STRC in about two trading days, but takes six to eight weeks in Strategy’s fixed rate preferreds. For a larger buyer, digital credit is today a decision on one instrument.
The Bar
To ask whether digital credit is liquid enough to be collateral, we need a bar. The natural one is the asset the financial system already treats as cash. The Treasury bill market turns over hundreds of billions of dollars a day and absorbs that flow with negligible price impact. Even the most liquid tradeable proxy for that market, the largest Treasury bill ETF, changes hands at only around $2.3b per day.
Figure 1: Digital Credit Trades Like a Preferred, Not Like Cash
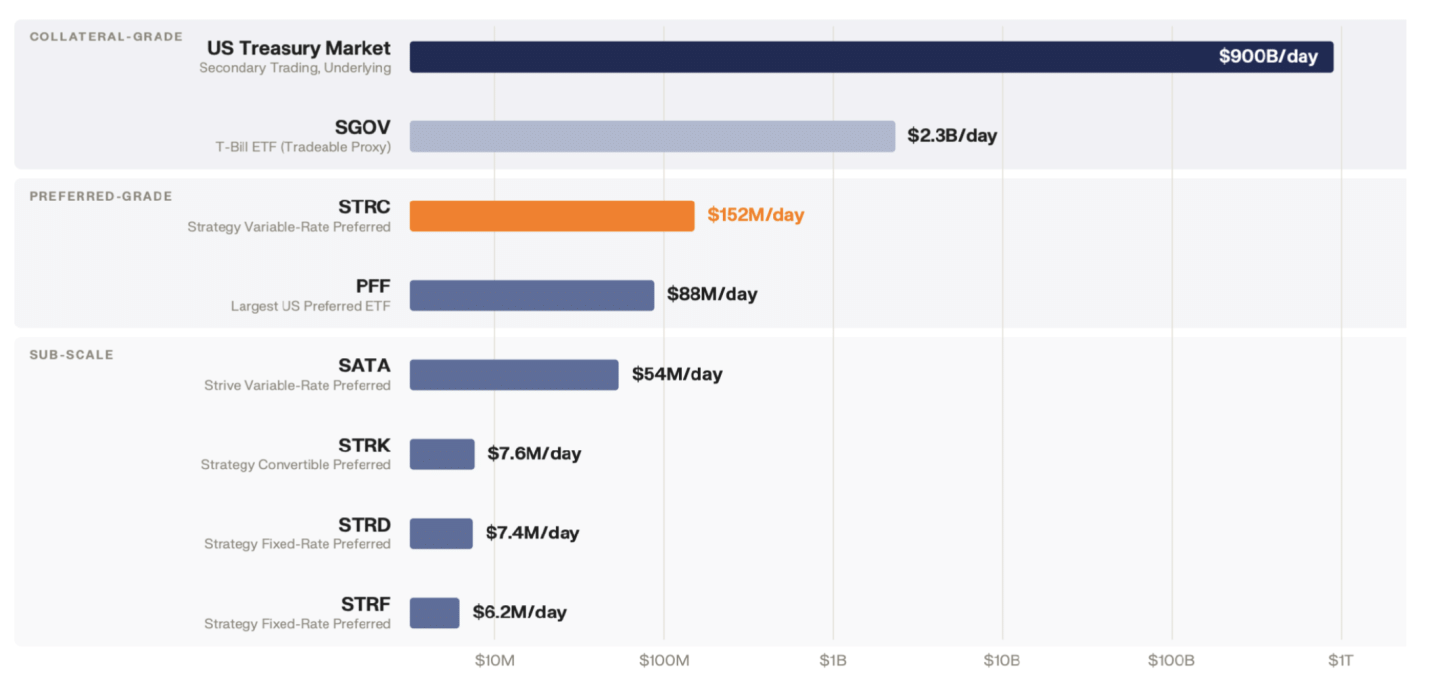
STRC, the most active instrument in the complex, trades around $150m per day. That places it alongside the largest listed preferred funds and comfortably ahead of its own digital credit siblings. This is respectable liquidity for a security that did not exist eighteen months ago, but it remains roughly 15x short of that tradeable proxy and orders of magnitude short of the bill market itself.
Depth, and What a Bad Day Does to it
Daily volume is a headline, not a measure of what a seller can actually move. The collateral use case demands tight price tolerances, so the threshold should be tight: we measure depth as the dollar value that shifts the price by ten basis points, a tenth of a percent. On that basis STRC absorbs on the order of $28m, an order of magnitude more than SATA or any of the fixed rate names. That is the typical day.
The number that matters to a risk committee is the atypical one. On the worst tenth of days STRC’s depth falls to around $6.5m and SATA’s below $0.5m. This is the first sign that liquidity here is a distribution rather than a level, and that the headline describes benign conditions far better than stressed ones. One preferred income manager who runs a mandate in exactly these instruments judges an instrument by its worst week, not its average day.
How Long it Takes to Exit
At 20% of average daily volume, selling a $50m position implies an execution horizon of under two trading days in STRC and around five in SATA. The same position takes six to eight weeks in the fixed rate preferreds.
Figure 2: Days to Exit, by Instrument and Position Size
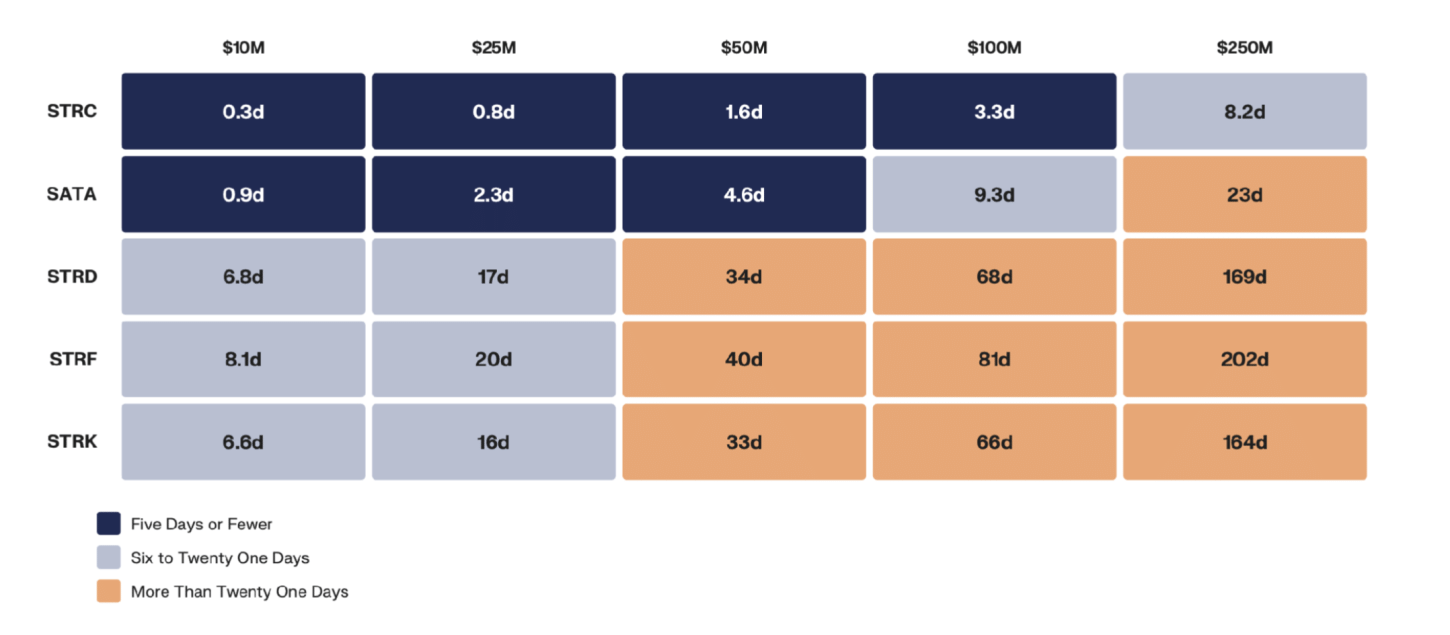
STRC clears the two week window comfortably. SATA now does too, having roughly halved its exit time over the summer as it seasoned and index inclusion drew in a passive bid. What caps a SATA line is no longer the clock but the price: any real size still moves it. At any real size, then, a digital credit allocation remains in practice a decision about STRC, with SATA a fast growing second option.
How Much of the Depth is the Issuer
Before that depth can be trusted, one question has to be put to it: how much of it is the market, and how much the issuer. Through the summer of 2026, as STRC traded below its $100 par, Strategy ran a repurchase programme that at its peak accounted for more than a quarter of the security’s weekly volume. Through September the issuer was still a fifth to a quarter of the tape in almost every week, easing to just under a fifth in the first week of October.
Figure 3: On the Worst Weeks, One in Four STRC Shares Traded Was the Issuer
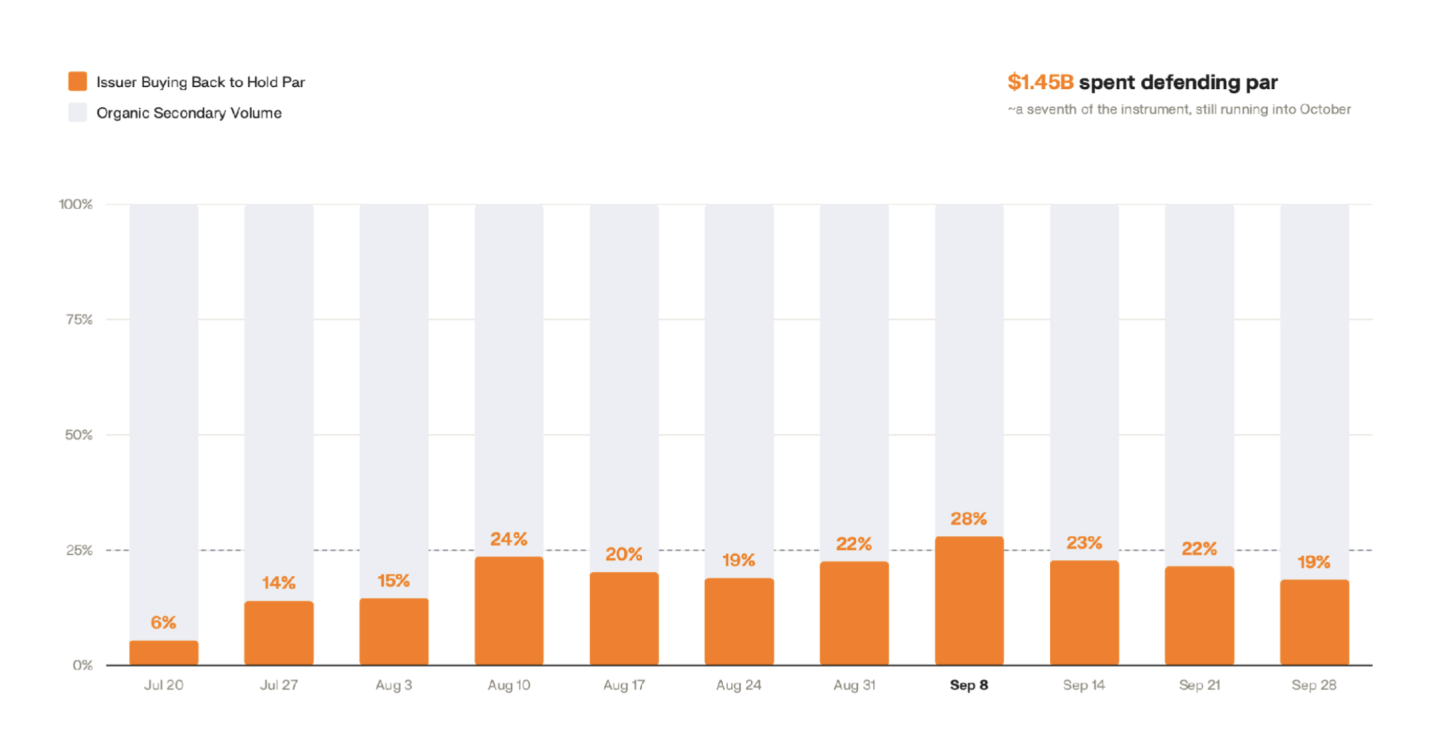
By early October the company had spent close to $1.45b, roughly a seventh of the instrument outstanding. The price recovered from the mid seventies of June to around $99.50, but had still not closed at par. An issuer willing to commit meaningful capital to defend its own paper can provide stability, but that support is discretionary. The task for a holder is to know how much of the visible depth leans on that backstop, because the day the issuer steps away is the day the organic market has to stand on its own. Adjusting for buybacks leaves estimated capacity nearer 80% of the headline, a more conservative starting point for sizing.
When Liquidity Actually Fails
In this sample, distance from par shows a much stronger relationship with illiquidity than Bitcoin’s daily price move does. On days when STRC sits close to $100, a holder can move size in and out without shifting the price. The further it drifts from par, the thinner the book becomes: roughly 4x less liquid once it is 1-3% out, and around 8x less liquid beyond 6%.
Figure 4: STRC’s Illiquidity Rises More Sharply with Distance from Par
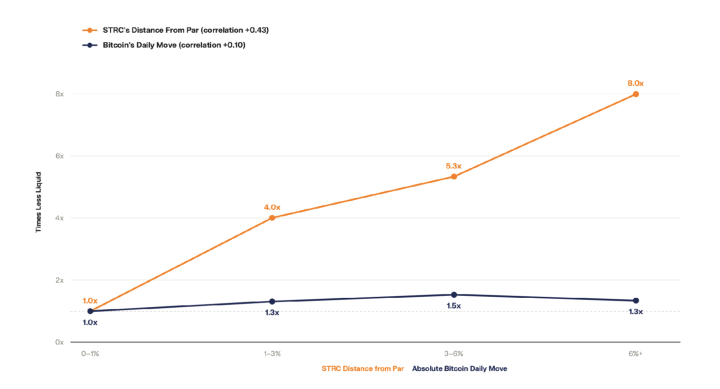
Holders own STRC as a par instrument, a way to earn a coupon on something that behaves like cash. Once it drifts from $100 it stops being that thing, and the bid that was there to clip the coupon steps back. The uncomfortable implication is that the book thins precisely when the price has already moved against the holder. The two risks a seller faces, a worse price and a thinner market, tend to arrive together rather than offset.
What a Depeg Costs
A typical departure from par has cost STRC holders something like seven months of coupon, and SATA holders rather more. The worst episode observed, STRC’s fall toward the mid seventies in June 2026, cost the equivalent of roughly two years of coupon. A double digit coupon on a par instrument is compensation for a real, if occasional, capital risk.
The Fifty Million Dollar Question
Mandate and liquidity settle the size question long before yield does. The instruments are unrated, carry just over a year of trading history, and pay a dividend the issuer may defer. These characteristics can fail the mandate screens that govern institutional allocations, and some pension and insurance mandates will exclude the paper before anyone considers liquidity.
That leaves a narrower and more interesting field. The investor who can write a large single ticket without a rating is neither the retail buyer, whose demand is real but arrives in small individual size, nor an institution whose mandate excludes the instrument. It is the tier between them: the HNWI, the family office, the private bank discretionary account, and the specialist credit or crypto native fund.
Consider a fund allocating $50m, 5% of a $1b book and a ticket typical of that tier. Even under the measured worst decile conditions, a $50m ticket moves STRC by less than one percent. In SATA the same ticket moves the price by about two percent on a typical day, and materially more under stress.
That caps a credible SATA position well short of the figure, and it removes the fixed rate names from contention before the discussion begins.
The point extends well past a single ticket, because liquidity binds harder as the asset class matures. A pension committing $500m to a Bitcoin-backed credit instrument will put the same question to the same data, with far less room for error. Should the shadow Bitcoin bank thesis hold, and these treasuries become standing issuers of credit, the tradability of their paper will decide whether institutional balance sheets can carry it at scale.
The Verdict
The answer is neither the bullish nor the bearish caricature. Digital credit has not yet demonstrated the dependable liquidity required for a cash-like role in financing. Nor is it the illiquid curiosity its critics imply. Its flagship already trades with the depth of a serious preferred, and it is deepening month by month.
The honest description is an asset class that is preferred-grade today, with growing trading activity in its variable rate instruments. The test is whether exit capacity keeps pace with the scale of the capital that may eventually seek to hold them.