
Crude Repricing
Every Monday, we deliver a concise yet comprehensive briefing to help you navigate the week ahead.
Our weekly market dashboard brings together key insights across Macro, Crypto, and Onchain activity, distilled into a clear, actionable format. Whether you’re managing risk or spotting opportunity, start the week informed and aligned.
Join our Telegram Channel to get it delivered directly to your phone.
Headline
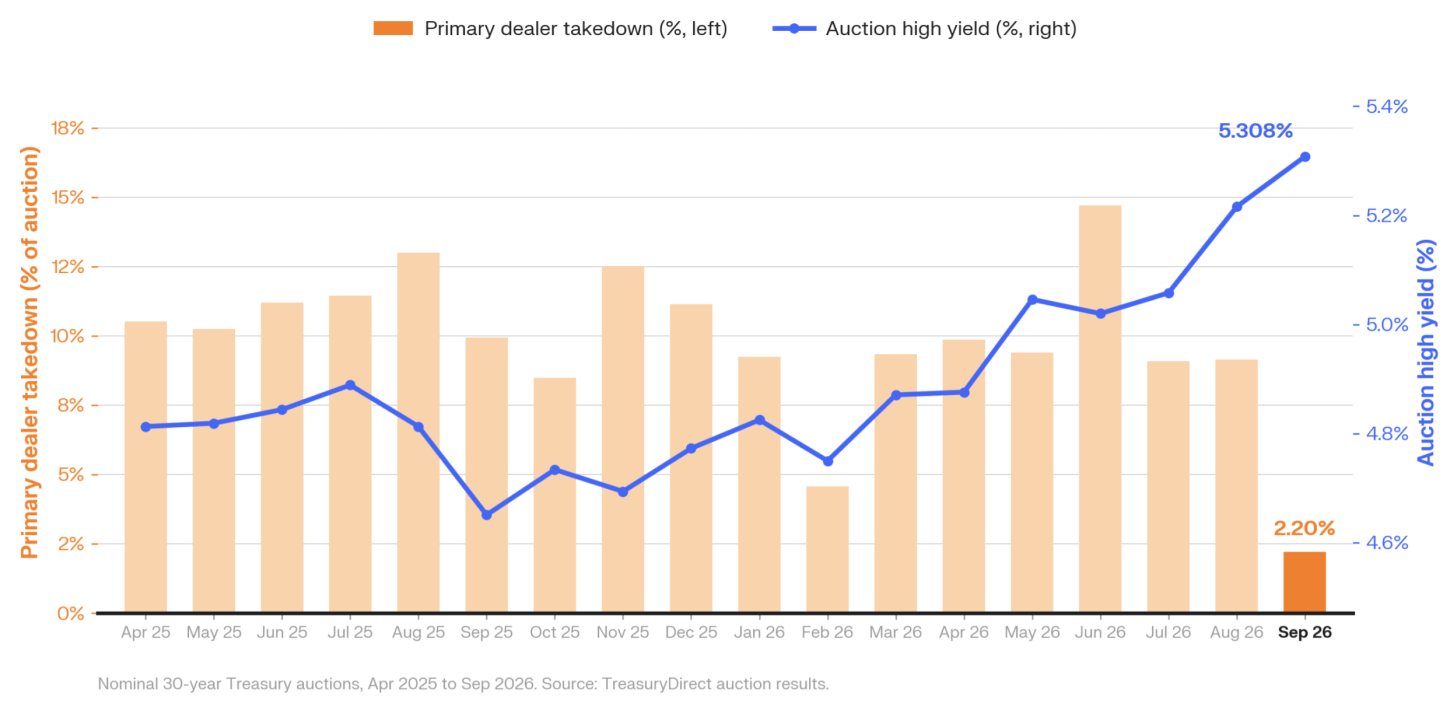
Buyers turned up for every Treasury auction this week and the long bond still hit its highest yield since 2007, which tells us the market is repricing inflation.
Proof
Brent rose 8% and broke $105 on Wednesday for the first time since July, closing at $108 after US strikes on Iranian tankers cut traffic through Hormuz to single digits.
August producer prices then printed at 5.4% on the year, September hike odds moved up through 70%, and the thirty year Treasury yield closed at 5.37%, its highest since June 2007. The ten year finished at 4.95%, five basis points below a level it has not closed above since 2007. What makes the move unusual is that the week’s supply was well bid. Primary dealers were left with only 2.20% of the thirty year auction, the lowest in at least two years.
The Treasury’s own buyback was the thing that came up short, accepting just $5.187bn of a $6bn maximum against $10.489bn offered, and yields rose after it. Thursday alone carried about 70% of the week’s move in yields.
So What?
We think this is the week the long end stopped being a story about what the Fed will do and became a story about what inflation will cost.
The Fed can move the front end on Wednesday, and somewhere between two thirds and three quarters of futures pricing says it will, but a quarter point does nothing about an oil driven inflation impulse or the term premium that has taken the thirty year to levels last seen in 2007.
Futures and prediction markets have pulled apart to a gap of 12 to 18 points on the same September decision, roughly triple where it sat a week ago, which is a market telling you it does not know.
And core producer prices actually came in below forecast at 0.2% on the month, with the yearly core rate at 4.6% against a headline of 5.4%, so the overshoot was energy, which is precisely the kind of supply shock central banks usually look through.
Nothing left to flush
Headline
Bitcoin fell 3% without leverage being forced out, which tells us last week’s flush did its job and this was spot selling into an already clean book.
Proof
Every sector we track finished the week negative. Privacy went from the best performer at 25.1% to a loss of 9.3%, with Zcash down 12.7% after gaining 25.65%, and the damage was worst in the places that had run hardest, with decentralised exchanges down 12.5% and Arbitrum the weakest of the top ninety at 30%.
Breadth still improved to 24 of 90 positive and the median asset fell 3.27%, more than a point better than Bitcoin. The leverage book barely moved. Bitcoin open interest finished at $52.97bn against $53.10bn on Monday, funding stayed positive every single day, and Ether open interest rose 1.21% even as its price fell.
Spot did the selling and it was selective, with US Bitcoin ETFs taking out $462.7m while Ether ETFs took in $196.9m.
So What?
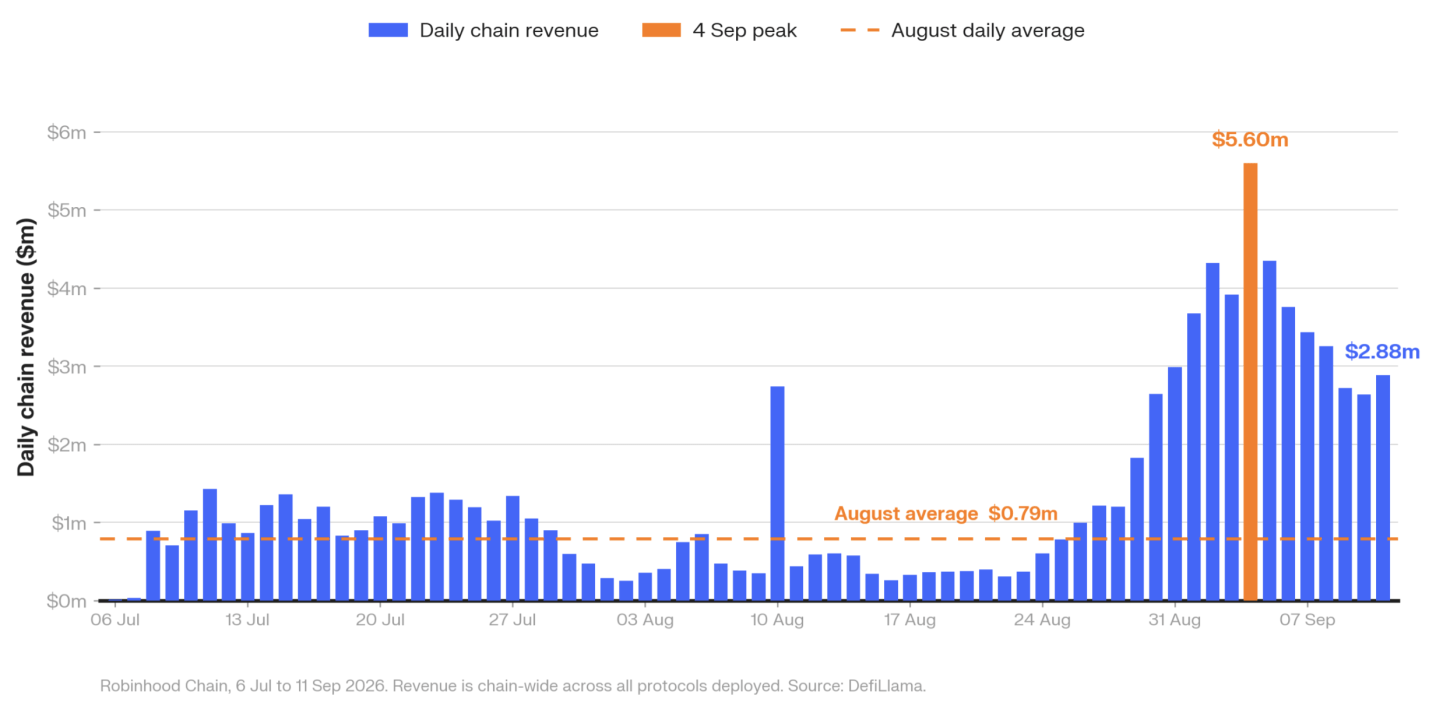
We read this as consolidation. There is little leverage left to force out and the selling is coming from spot. Robinhood Chain shows the same thing from the other side.
Daily revenue has halved from its September 4 peak and still runs at 3.7 times its August average, so the speculative base is intact even as the urgency has drained out of it. That is the backdrop heading into Tuesday’s cloture vote on the CLARITY Act, which needs sixty votes just to move the bill onto the floor.
The market has barely engaged with it, pricing the bill becoming law this year at about 17% and holding in the mid teens for a fortnight. We think that makes Tuesday an asymmetry, since a pass is not in the price.
Below Cash
Headline
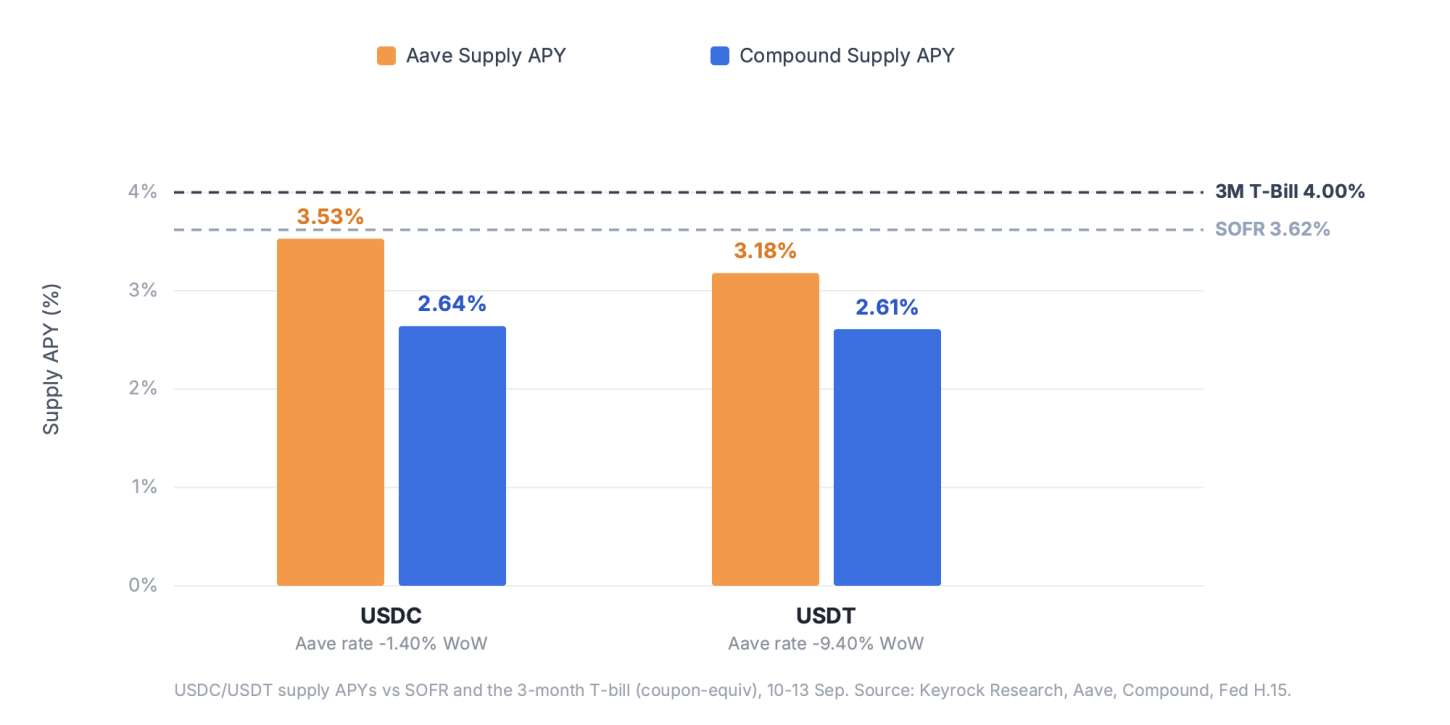
Onchain stablecoin lending slipped further below cash this week. USDC’s supply rate fell -11.40% WoW and USDT dropped -9.40%, yet deposits into both rose, +2.90% and +6.72%, which is what you see when money is parking rather than getting borrowed.
We asked last week whether stablecoin demand would push the USDC rate back above the T-bill line. Instead the rate fell and the line rose, with a Fed hike now priced for 16 September.
Proof
Aave USDC sits at 3.53% and USDT at 3.18%. Set against a 3-month T-bill at 4.00% coupon equivalent, 3.86% on a discount basis, and SOFR at 3.62% as of 10 September, every passive onchain stablecoin rate now sits below cash, a negative spread of 35 to 80bp before smart contract, peg and counterparty risk.
The rate fell because deposits flooded in faster than anyone borrowed them, USDT supply grew +6.72% and USDC +2.90%. WETH was the one exception, its rate up +1.40% on near flat deposits of +0.28%, a thin leverage bid rotating to ETH.
The flow data said the same thing, capital left the base layers, Arbitrum -$77.0m, Ethereum -$59.1m and BNB -$39.6m, and moved into execution venues, Robinhood Chain +$83.1m and Base +$56.7m, with Hyperliquid flipping to -$15.6m after last week’s haul.
RWA rolled over too, aggregate AUM -0.81% WoW after +0.78% the week prior, Centrifuge down a second straight week at -2.76% as its CP172 vote over 3-10 September approved converting the CFG token into tokenised equity, a clear overhang on the token.
So What?
The gap between onchain and cash is about to get wider. A 3-month bill at 4.00% already beats Aave USDC by roughly 47bp, and a 25bp hike on 16 September, priced above 80%, pushes cash further out in front while onchain rates drift on parked, unborrowed stablecoins.
At these levels the yield does not pay for the risk, and the capital clearly knows it, which is why it is sitting in supply and rotating toward venues that offer activity rather than carry. The cleaner institutional read is Centrifuge, where a token-to-equity conversion is a structural signal rather than a market one.
Watch the 16 September FOMC, whether Aave USDC can reclaim the 4.00% cash line once the hike lands, which is a taller order now, and Centrifuge’s AUM through the conversion as the tell on institutional appetite for RWA.
Liquidity Picks Par
Headline
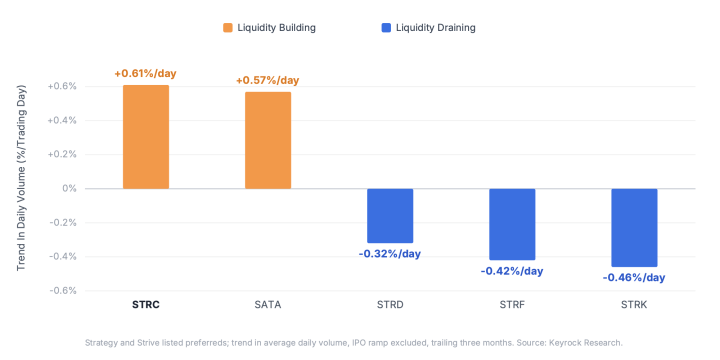
Digital credit is the corner of the Bitcoin treasury market where companies like Strategy issue preferred shares to fund their Bitcoin buying. The ‘par floaters’ among them, STRC and SATA, reset their dividend to hold the price near $100, so they behave more like a cash plus product than a bond. Liquidity is now pooling in exactly those names.
STRC and SATA are the only preferreds in the stack with deepening liquidity, compounding at +0.61% and +0.57% per trading day, while the fixed rate and convertible legs bleed at -0.32% to -0.46% per day. The buyer base is voting with its flow, and it wants a par targeting, preferred structure.
Proof
The gap is already an order of magnitude, and widening. STRC turns over around $138m per day, more than the largest US preferred ETF, PFF, at roughly $75m per day, though still some 30x short of collateral grade depth like the SGOV T-bill ETF at $2.2b per day.
The other legs are far thinner, SATA at $26m, STRD at $8.2m, STRF at $7.6m and STRK at $6.4m. Depth is what buys allocators an exit from the instrument, and thus liquidity acts as a gating factor, clearing a $50m position at 20% of daily volume takes 1.8 trading days in STRC against 9.8 in SATA, 30 in STRD, 33 in STRF and 39 in STRK.
And it holds up when it matters, on a typical day about $26m trades before a 10bp move, and even on the worst tenth of days $6.2m still clears, with illiquidity tracking distance from par at +0.42 but Bitcoin’s daily move at only +0.11.
Some of that depth is bought, this month Strategy doubled its STRC buyback authorisation to $2b after a single $176m repurchase week, taking cumulative par defence past $800m, on the worst weeks up to 24% of STRC’s tape.
So What?
A tape compounding at +0.6% per day is an entry ramp to a different buyer base. At that pace STRC roughly doubles its daily volume inside a year, and volume is the gate to larger tickets, model portfolio sleeves and eventual preferred index or ETF inclusion, each of which imports its own flow.
The freshest print complicates that story, STRC’s liquidity is increasingly issuer supported, so the name to watch is SATA, which held $100 par for over a week in early September and funded a fresh 1,800 BTC purchase through issuance while Strive’s common ran +60% YTD, and did it without STRC scale buybacks.
If SATA keeps compounding its +0.57% per day tape on organic flow while STRC leans on a doubled authorisation, the market is telling us which par floater design actually clears.
Watch STRC’s next weekly repurchase against the 24% of tape ceiling, and whether SATA closes the volume gap without a matching buyback line.