
Bitcoin Weakens as Broader Markets Hold
A retreat in Bitcoin buying stood out against a more stable cross-asset backdrop.
Historical review · October 2026
Based on the dated charts and reference briefing, Buyers Step Back. Figures use the observation windows stated below. This is historical analysis, not a live market feed.
Market Overview
The October 12 market briefing described Bitcoin falling around 2.5% during a week in which the S&P 500 reached a record and gold, the dollar and the Nasdaq moved comparatively little. Oil-related concerns coincided with a sharp withdrawal of ETF demand. The contrast suggested that the availability of buyers mattered as much as the headline macroeconomic news.
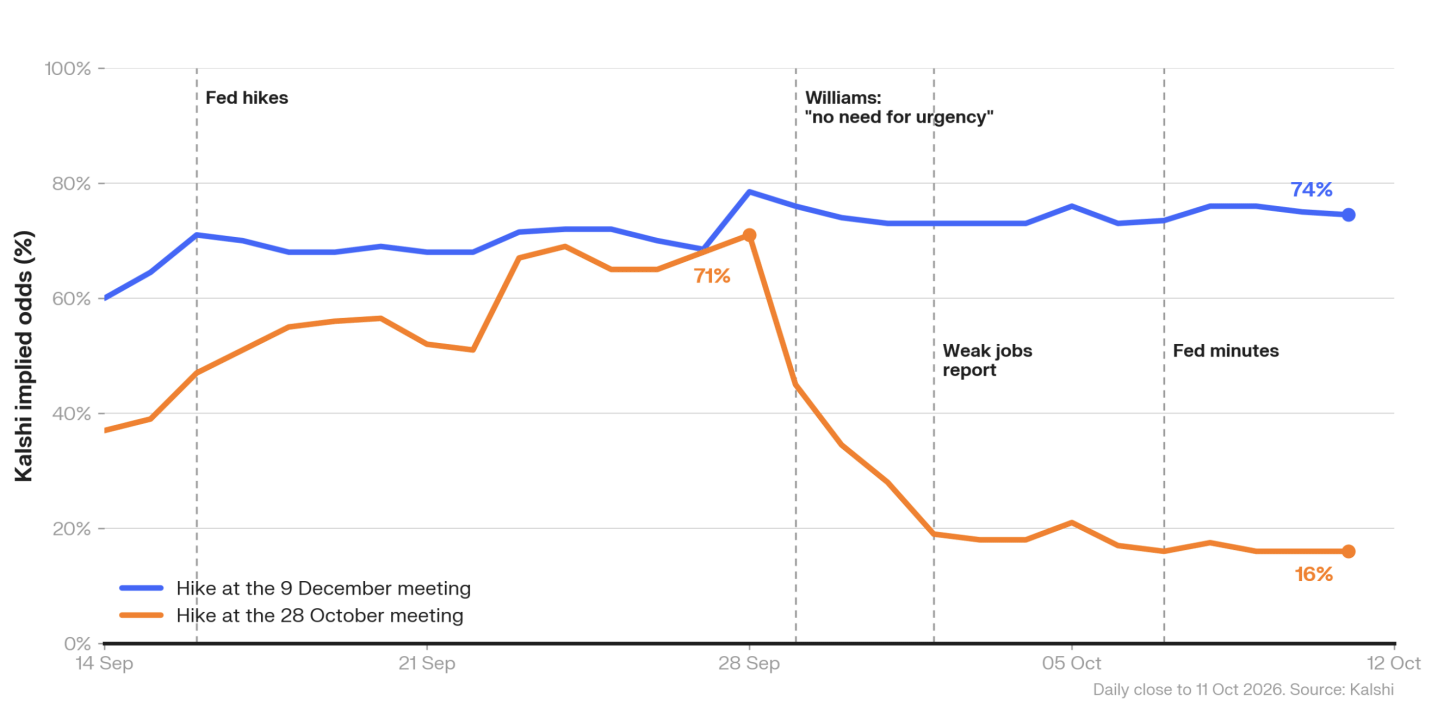
The policy-pricing chart adds an important distinction. By October 11, the implied probability of an October 28 rate increase had fallen to 16%, while the December 9 probability remained at 74%. These are probabilities derived from Kalshi markets, not official Federal Reserve forecasts or guaranteed outcomes.
Evidence and Context
The reference briefing reported a move from approximately $85,300 to below $84,000 in about 25 minutes on Wednesday, followed by a Thursday low near $80,300. Across those two sessions, spot Bitcoin ETFs lost roughly $729 million. The timing linked reduced institutional demand with the price decline, although coincidence alone cannot establish a single cause.
Crypto long liquidations were reported at approximately $1.2 billion on Thursday. Funding had already been below its usual level and open interest below its September peak, so the briefing interpreted forced selling as an amplifier rather than the initial source of the move. That distinction separates a withdrawal of spot support from a market already crowded with leveraged longs.
The reference also cited a Bitwise estimate placing the average ETF investor’s cost near $83,000. That was a contextual estimate, not a verified support level. The Thursday low remained above the cited September low of $75,590, leaving a question about whether existing holders would maintain exposure as prices approached their estimated entry levels.
The approximately 2.5% decline here is the first chapter’s reported weekly comparison. The Monday-to-Sunday figure in the following chapter and the through-Friday figure in the onchain discussion use different observation windows; they should not be combined into a single return.
What This May Indicate
The historical interpretation was that buyers had stepped back more sharply in Bitcoin than in other major assets. The same oil and rates concerns did not produce an equivalent reaction everywhere. That makes the persistence of ETF participation a more useful follow-up than assuming every move was part of a uniform cross-asset sell-off.
At the time of the briefing, the next inflation release was the immediate test. A stronger reading could have revived near-term tightening expectations, while a softer result could have eased that pressure. This was an outlook from the October 12 reference period, not a current forecast.
A recovery supported by renewed cash demand would be different from a bounce driven mainly by leveraged exposure. The distinction becomes clearer when fund flows, funding and open interest are read together.
ETF Demand Reverses as Leverage Eases
The cash-funded rally lost support while derivatives positioning became less stretched.
Market Overview
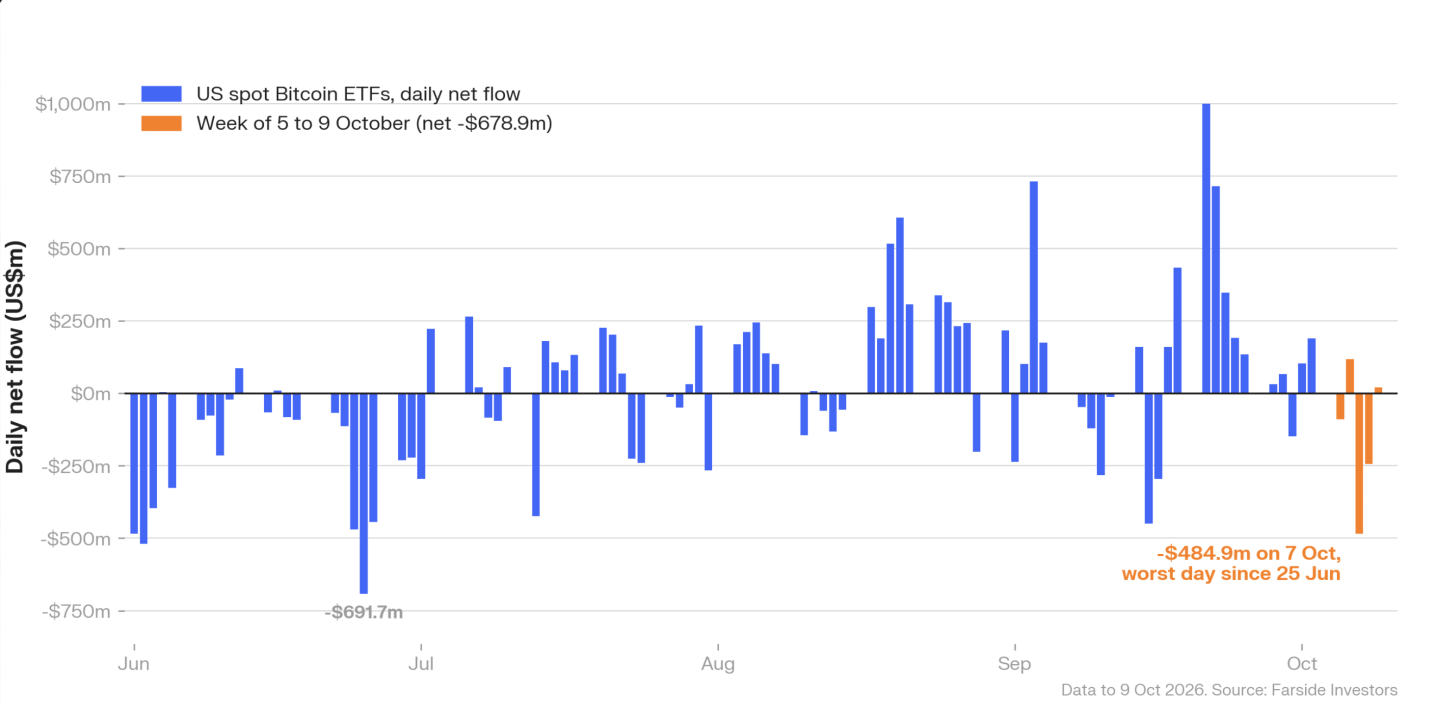
The preceding three-week run of ETF inflows reversed in the reference period. Bitcoin and Ether funds together lost approximately $1.17 billion, commonly rounded to $1.2 billion in the briefing. Bitcoin accounted for $678.9 million of that withdrawal, while Ether funds lost $491.4 million.
At the same time, leverage declined in a relatively orderly way. The reported pattern was not simply a large pool of leveraged positions unwinding first and dragging spot markets behind it. Cash demand weakened, and derivatives exposure contracted alongside the decline.
Evidence and Context
The chart shows daily Bitcoin ETF flows through October 9. The orange bars isolate October 5–9, a week totaling −$678.9 million. October 7 alone recorded −$484.9 million, identified in the chart as the largest daily withdrawal since June 25. The approximately $729 million two-session figure is a separate subtotal, not an additional outflow to add to the weekly number.
The reference reported Ether outflows across nine consecutive sessions, with Solana and Hyperliquid products losing another $34 million combined. These figures describe the products covered by the briefing; they are not a complete census of global spot activity.
Bitcoin open interest was reported down 4.8% to $52.4 billion, and Ether open interest down 7.5% to $31.6 billion. Funding remained below 0.01% through the week and briefly turned negative for Ether on Saturday. The reference did not specify a universal venue or funding interval, so that percentage should not be treated as an annualized rate or a threshold applicable to every perpetual contract.
On the briefing’s Monday-to-Sunday basis, Bitcoin fell 3.4%, Ether 7.1% and Solana 8.7%; memecoins declined 9.5% and DeFi 6.5%. The period differs from the shorter comparisons elsewhere in the article.
The reference described exceptions tied to specific narratives: Starknet doubled amid discussion of a standalone, quantum-resistant layer-one direction, while NEAR rose 18% alongside ETF demand and a proposed reduction in token issuance. Those moves lifted the reported layer-two and AI groups by about 6% each, even as the same groups excluding the standout tokens fell about 4%. These are attributed historical observations, not VALYQOR trading results.
What This May Indicate
The change in ETF flows challenged the idea that cash-funded participation would necessarily remain steady through macroeconomic stress. A reversal within two sessions suggested that the marginal investor was responsive to oil and rate expectations, even after several weeks of buying.
Lower open interest and subdued funding indicated less stretched positioning than the price decline alone might imply. They did not prove that liquidation risk had disappeared. A sustained recovery would still need buyers willing to absorb supply rather than relying only on a squeeze or on newly borrowed exposure.
The contemporaneous watch list was straightforward: a return to consecutive Bitcoin ETF inflows, an end to Ether’s redemption streak, and funding that stayed contained during a rebound. If funding accelerated before cash participation improved, it would suggest that leverage was returning faster than durable spot demand.
Onchain Lending Yields Approach Treasury Rates
Borrowing demand narrowed a yield gap that had persisted for much of the year.
Market Overview
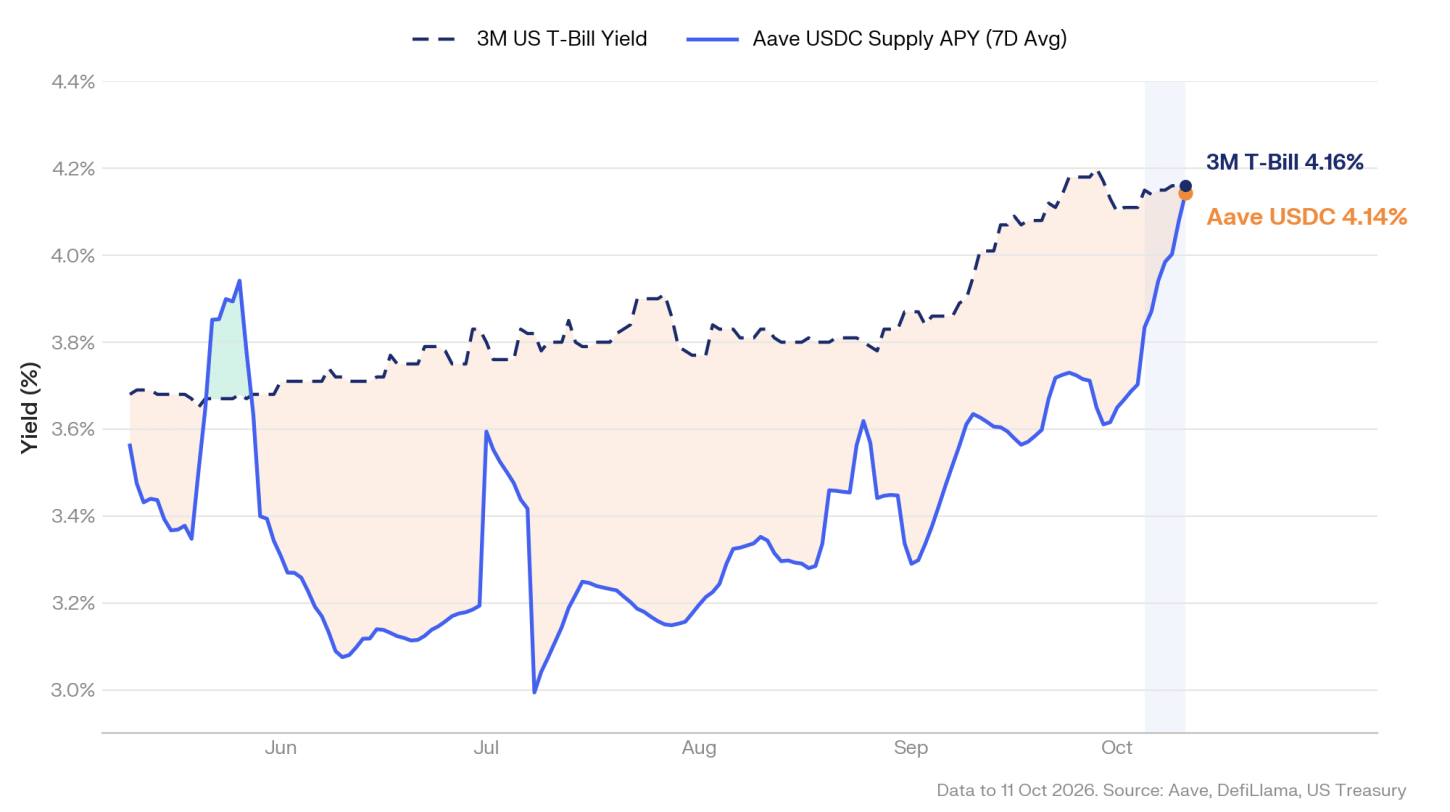
For much of the period from May onward, Aave USDC supply yields sat below the three-month Treasury bill yield. The reference briefing put the gap at 74 basis points in late July and 41 basis points on October 4. By the chart’s October 11 endpoint, that gap had narrowed to approximately 2 basis points.
The plotted seven-day average USDC supply APY is 4.14%, against a 4.16% Treasury yield. The accompanying text used 4.13% for a separate rate observation and described an 11.32% week-over-week increase. The chart and text therefore should not be presented as a single identical measure: the displayed average is close to, but still below, the Treasury benchmark.
Evidence and Context
The reference reported USDC deposits increasing only 0.33%. A rising supply rate with relatively flat deposits was interpreted as stronger borrowing demand relative to available liquidity. The Treasury benchmark had also moved higher, from approximately 3.68% in May to 4.16%, so the gap closed against a rising comparison rate.
Other pools showed a different pattern. USDT deposits were reported down 5.28%, with its supply rate down 7.80% on a relative basis. WETH deposits fell 4.70%, while its rate declined 2.94% to 1.32%. These relative percentage changes are not percentage-point changes in APY.
The onchain discussion used through-Friday price declines of 2.81% for Bitcoin and 6.77% for Ether, and reported more than $1 billion of liquidations on October 8. Those cut-offs differ from the Monday-to-Sunday returns in the preceding chapter.
The cited chain-flow snapshot showed $137.2 million leaving Hyperliquid as HYPE moved from around $93 to $85 following a reported October 6 team unlock. Arbitrum received approximately $109 million, with Optimism receiving $75.9 million and Base $48.2 million. The reference connected Arbitrum’s inflow with USDG availability and incentive activity; these flows do not by themselves establish how much capital was newly invested rather than transferred.
The reference also cited an October 11 report describing two positions holding about 97% of syrupUSDC supplied to Aave on Arc, with health factors near 1.01 and 1.02. That narrowly defined pool observation should not be generalized to all Aave positions. It illustrated how concentrated collateral and limited liquidation buffers can matter when borrowing costs rise.
What This May Indicate
The yield advantage previously shown by the Treasury comparison had largely disappeared in this snapshot. That changes the nominal yield comparison, but it does not make Treasury instruments and onchain lending equivalent: maturity, liquidity, access, credit arrangements and smart-contract exposure differ.
If higher borrowing demand persisted, new deposits could help contain the USDC rate. If borrowing weakened, the gap could reopen. For leveraged loops, a higher funding cost can compress the margin between the yield earned on collateral and the cost of borrowed stablecoins, especially where liquidation buffers are thin.
The original forward-looking checkpoints were whether the seven-day USDC average would remain near the 4.16% benchmark, the October 13 Maple update, and the October 15–22 Arbitrum vote relating to USDG growth. They are retained as historical checkpoints rather than presented as upcoming events today.
Distribution Reshapes Tokenised Equity Markets
Platform reach and collateral utility became central to the competition for adoption.
Market Overview
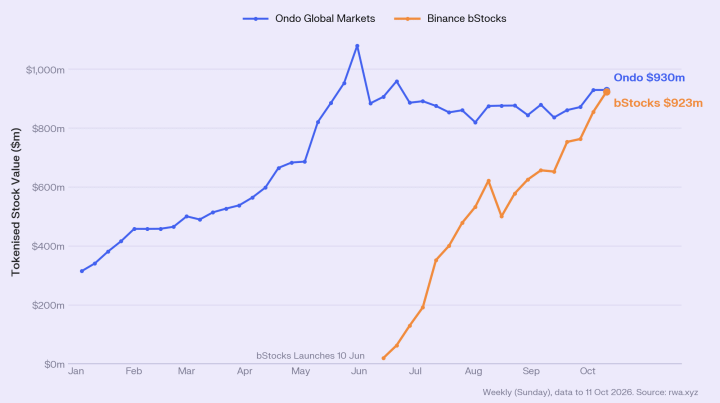
The final chart shows bStocks approaching Ondo Global Markets in tokenized equity value. At the October 11 weekly endpoint, the labels read $923 million and $930 million, respectively. On those rounded values the difference is approximately $7 million.
The reference text described a roughly $6 million gap and separately cited $1.9 million on October 9. Those readings are not interchangeable with the chart’s rounded October 11 labels. This review uses the chart values for its direct comparison and keeps the timing distinction explicit.
Evidence and Context
The reference briefing described bStocks growing from roughly $4 million around its June launch to $923 million about four months later, including a $68 million increase during the latest week, or approximately 7.9%. Ondo was broadly flat over that week and about 14% below a reported $1.08 billion May peak.
Binance’s product documentation identifies bStocks as tokenized securities issued by BTech Holdings Limited, a Binance group affiliate. They provide exposure through a tokenized instrument rather than direct ownership of the underlying company’s shares. The uploaded chart’s June 10 annotation is retained; the public launch announcement is dated June 11, so the two dates are not silently treated as identical.
The reference estimated that each platform accounted for around 27.5% of a $3.37 billion tokenized stock market, which had grown 4.4% week over week and approximately 4.9 times year to date. It placed about $1.22 billion, or 36%, on BNB Chain and reported Robinhood’s platform down 6.4% to $161 million. These are the reference period’s market-value estimates, not current balances.
The wider discussion described new tokenized-stock availability on Solana and a lending integration on Base involving Aave V4’s Equities Hub. Those developments were used to frame the potential role of collateral utility. The specific integrations are reported as reference claims; they are not a statement that VALYQOR offers access to these products.
The values shown come from a market-value series attributed within the chart to rwa.xyz. A rising total can reflect changes in underlying share prices as well as issuance or redemptions. It should not automatically be described as an equivalent amount of new cash entering the market.
What This May Indicate
The historical comparison suggested that an established distribution network could narrow an early entrant’s lead quickly. Product design and integrations matter, but so does putting a product in front of users who already have accounts and operational familiarity with a platform.
The next question was whether the instruments would become useful collateral rather than remaining isolated trading exposures. Borrowing support can increase utility, but its significance depends on collateral eligibility, liquidity, haircuts, liquidation mechanics and the reliability of the underlying structure.
For VALYQOR, the research connection is between market access, financing and infrastructure. This section examines external market development; it does not describe a VALYQOR asset-management service, token issuance business or partnership. Across all four chapters, the aim is to distinguish where capital is moving, how exposure is funded, and which conditions would change the interpretation.