
Bitcoin and Gold Take Different Paths
Policy expectations, ETF flows and options positioning tell different parts of the same story.
VALYQOR examines how macroeconomic conditions, derivatives positioning and onchain capital flows interact. This review connects the underlying signals to help readers understand the forces shaping digital markets.
Reference period · 2–5 October 2026
Adapted from the supplied charts and Keyrock’s Bond Voyage briefing. Figures and event descriptions are attributed historical observations, not independently verified live market data.
Market Overview
The reference briefing for early October described Bitcoin advancing for a third consecutive week while gold declined. The divergence occurred alongside a rise in long-dated US Treasury yields, illustrating that assets often grouped together as alternatives to fiat money can respond differently to the same macroeconomic environment.
Its cross-asset snapshot put Bitcoin up 2.5% at $85,837 and gold down 2.5% at $4,160. The dollar index rose approximately 1% to 102, while the Nasdaq 100 gained 0.7%. These are historical observations from the reference period, rather than live quotations.
Evidence and Context
The briefing attributed most of Bitcoin’s advance to Thursday and Friday, when spot ETF flows turned positive and short covering supported prices. It also reported a roughly 43% third-quarter gain. The combination of cash buying and the closing of bearish positions matters: both can lift price, but they represent different sources of demand.
The inflation release cited in the reference showed core PCE at 3.0%, below a 3.3% forecast. In that account, the estimated probability of an October rate increase fell from approximately 71% to 25%. Yet the thirty-year Treasury yield reached 5.64%, as oil above $100 and substantial debt issuance continued to weigh on longer maturities. A softer near-term policy outlook did not necessarily mean cheaper long-term funding.
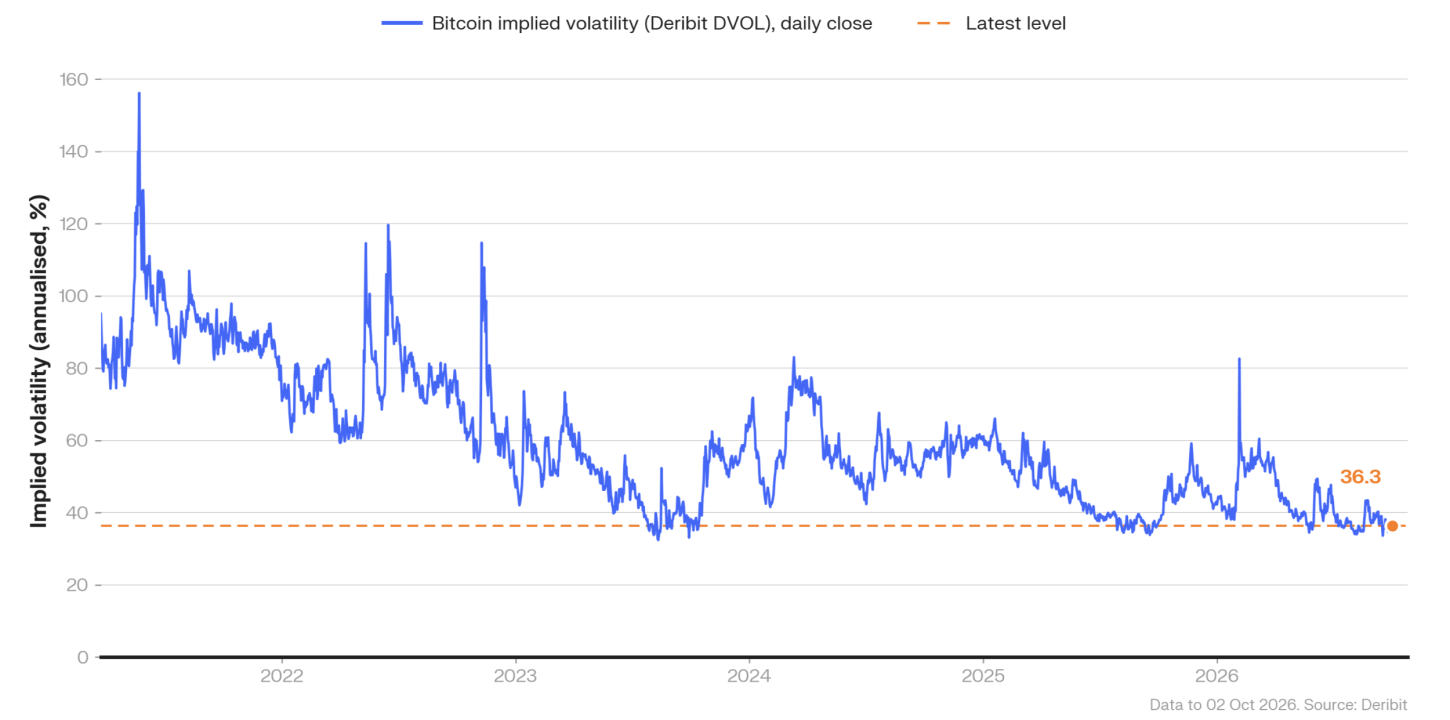
The supplied DVOL chart ends at 36.3% on October 2. The reference placed volatility near the lower end of its post-2021 distribution, stating that only about 5% of daily closes had been below that area. Low implied volatility describes the price of expected movement; it does not establish that the next move will be small.
Options activity in the reference included a repeated switch from October to November $90,000 calls: 6,000 BTC of October exposure was sold against the purchase of 2,700 BTC of later-dated exposure. It also described approximately 3,700 BTC of October $70,000 calls being purchased. Put buying was concentrated around the October 1–3 employment window, while later-October call positioning clustered near $90,000–$100,000.
Market Implications
The distinction is between the expected policy path and the return investors require to hold long-term bonds. Higher bond yields can increase the opportunity cost of holding gold, while Bitcoin can simultaneously respond to improved ETF demand, short covering and a lower perceived probability of an imminent rate increase.
The reference interpreted the smaller, later-dated call position as maintaining upside exposure while allowing more time. That is one interpretation of positioning, not proof of a trader’s intent. Its broader constructive view also noted that Bitcoin remained roughly 31% below the October 2025 peak. The useful question is whether further gains attract sustained spot demand, rather than relying on a temporary squeeze.
Leverage Returns Before Spot Conviction
Rebuilding open interest is more informative when read alongside cash-market participation.
Market Overview
The derivatives section of the reference used a separate weekly snapshot: Bitcoin gained approximately 2.4% to $86,530. Its central observation was that borrowed exposure was recovering more quickly than conviction in the spot market. This price is kept separate from the earlier cross-asset snapshot rather than treated as the same closing observation.
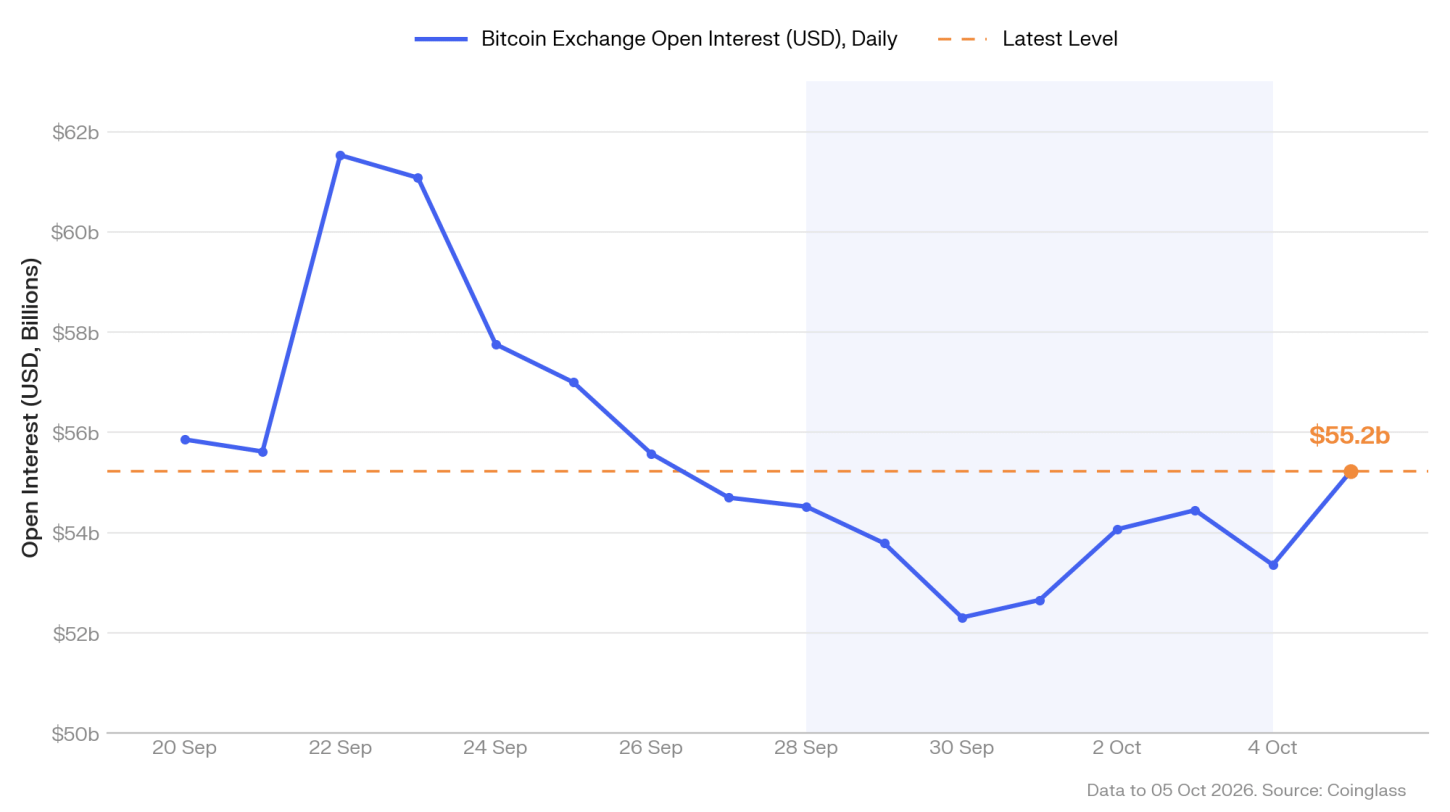
Open interest had declined from approximately $61.5 billion on September 22 to $52.3 billion on September 30. It rebuilt toward $54.1 billion before the employment release and was subsequently reduced again. The chart’s October 5 endpoint is $55.2 billion. Those successive readings show a changing position base, not a continuous one-way expansion.
Evidence and Context
The reference associated the initial reduction in leverage with a stronger-than-expected flash PMI reading, a roughly $15.6 billion quarterly options expiry and quarter-end risk reduction. Bitcoin’s inability to hold the reported yearly opening level near $87,570 provided another test of buying strength.
Spot Bitcoin ETFs took in $82.9 million during the cited week, compared with $2.39 billion the week before. A $148.7 million outflow on September 30 ended a nine-day inflow sequence. Within the weekly totals, IBIT received $292 million, while FBTC and GBTC lost $167.9 million and $54.6 million respectively. Gross flows across individual products should not be mistaken for the net industry total.
The same account put Bitcoin open interest down roughly 2.4% over its weekly comparison and Ether open interest down 0.7%. Funding remained positive, with the Bitcoin open-interest-weighted eight-hour rate peaking on October 2. Following payroll growth of 29,000 against an 84,000 expectation, the reference described Bitcoin moving from approximately $87,200 to below $84,000 and more than $570 million in liquidations, overwhelmingly in long positions.
Ether ETFs recorded $138 million of outflows, including $74.1 million from FETH, following $689.8 million of inflows the preceding week. Sector performance was uneven: gaming gained 21.6%, supported by a 68% SAND move; STRK rose 39.5% despite a negative layer-two median. Privacy and AI groups declined, with the reference linking ZEC’s retreat to a reversal of earlier gains and NEAR’s weakness to a reported security incident. These event explanations are attributed to the reference, not independently established by the chart.
Market Implications
At the October 5 snapshot, open interest was back near $55.2 billion and funding around 5.5% annualised. Positive funding alongside modest ETF participation suggested that leveraged exposure was rebuilding without equally strong cash demand. Open interest alone cannot identify whether all new positions were directional, hedged or part of a basis trade.
The reference’s historical watch list included the October 7 FOMC minutes, October 14 inflation release and an October 6 HYPE unlock valued at about $340 million. Its test for stronger participation was a sustained move above $87,570 accompanied by a meaningful recovery in ETF inflows. Those dates are retained as the original review’s checkpoints, not presented as future events today.
The practical analytical distinction is the source of a rally. Price supported by a broader cash buyer base has different funding dynamics from price supported mainly by increasingly expensive borrowed exposure. Neither configuration guarantees a particular outcome.
Onchain Capital Favors Yield Over Leverage
A growing deposit base can coexist with softer borrowing demand and lower lending yields.
Market Overview
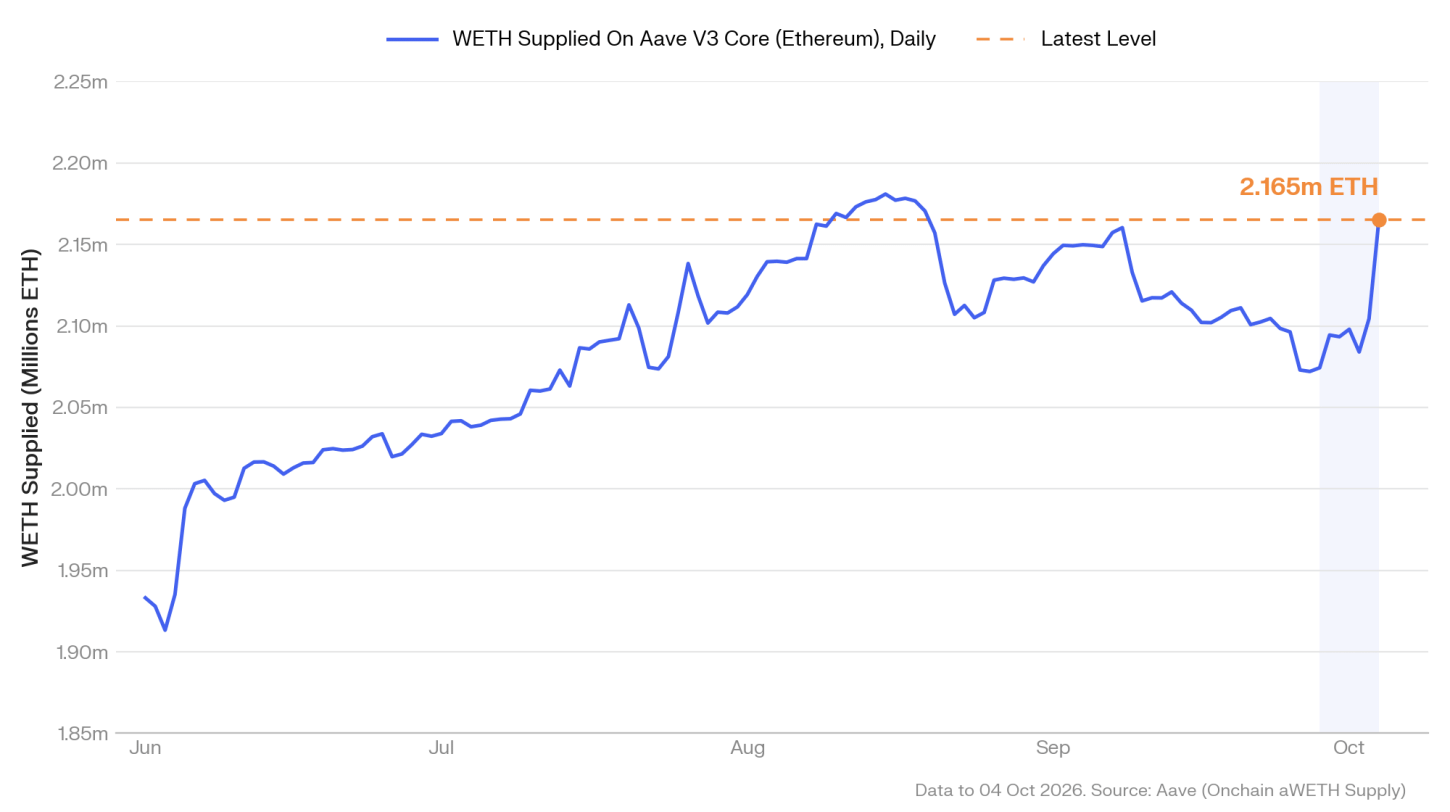
The supplied Aave chart shows WETH supply reaching approximately 2.165 million ETH. The reference reported around 93,000 ETH of new weekly supply and a dollar deposit value of $5.89 billion, up 7.6%. The change in dollar value and the change in token quantity are different measures and should not be used interchangeably.
During the same period, the WETH supply APY declined from 1.47% to 1.36%. More available capital alongside a lower supply rate was consistent with deposits outpacing borrowing. The reference contrasted this with the $138 million withdrawal from spot Ether ETFs: holders could be seeking lending income without necessarily increasing leveraged market exposure.
Evidence and Context
Of the reported 93,000 ETH increase, about 60,000 ETH arrived on October 4. The briefing also cited a 20,000 ETH transfer from Bitfinex to Aave on October 3. These observations identify timing and flows; they do not establish that every deposit came from the same owner or followed the same strategy.
USDC showed a different balance. Deposits were nearly flat, up 0.2% to $2.41 billion, while the supply APY increased from 3.58% to 3.71%. The reference read that combination as stronger borrowing demand relative to liquidity. USDT deposits fell 0.6% to $2.88 billion and its APY eased from 3.75% to 3.72%, following a reported adjustment in optimal utilisation from 93% to 94%.
WBTC deposit value rose 4.0% to $2.98 billion while token quantities were broadly unchanged, highlighting the effect of underlying price changes. In the chain-flow snapshot, Hyperliquid lost $208.2 million, Arbitrum received $123.6 million and the Hyperliquid bridge reserve on Arbitrum declined by approximately $182 million between September 28 and 30.
The reference compared those flows with $396 million of USDC moving onto Hyperliquid in the preceding week. It also described $46.7 million flowing to Base, new tokenised-stock availability and a modest 0.35% rise in tokenised-asset value. Its Paxos and Securitize observations emphasised the role of underlying asset prices rather than assuming that all changes represented fresh deposits. These are external market developments, not VALYQOR products or asset-management services.
Market Implications
At 3.71%, the cited Aave USDC supply rate was 29 basis points below the 4.00% three-month Treasury bill benchmark. The reference reported that it had exceeded the bill yield on only 41 of 278 days in the period examined. Its tokenised-Treasury comparison averaged 3.66%. Those observations describe the selected instruments and dates, not every available onchain yield.
The nominal rates do not make lending pools and Treasury instruments interchangeable. Access, liquidity, collateral structure and smart-contract exposure differ. For the selected pools, the figures suggested that collateral utility and ready access to liquidity could be as important as a headline yield premium.
The reference also identified a potential later supply increase from a reported validator exit of roughly 523,000 ETH associated with MetaMask, subject to an exit queue and distribution timing. That event claim is not verified by the WETH chart itself. Its analytical scenario was conditional: if additional ETH entered Aave without matching borrowing demand, supply APY could fall further.
The historical monitoring points were WETH supply rates, Hyperliquid’s reported $7.43 billion stablecoin base after the unlock, and the gap between USDC lending yields and Treasury bills. Together they help distinguish capital being parked for income from capital being borrowed to add exposure.
Higher Yields Raise the Cost of Capital
Long-term financing conditions can tighten even when near-term policy expectations ease.
Market Overview
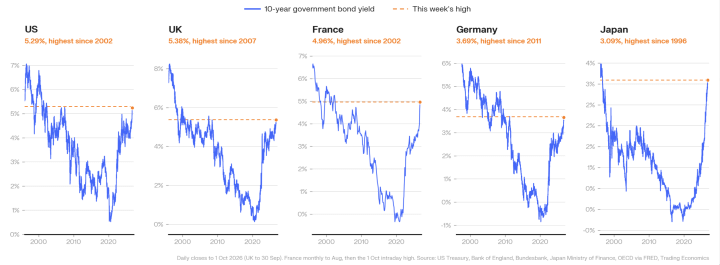
The final reference chart compares ten-year government bond yields across five major economies. Its highlighted levels are 5.29% for the United States, 5.38% for the United Kingdom, 4.96% for France, 3.69% for Germany and 3.09% for Japan. The chart’s source line specifies its observation dates; the labels should not be interpreted as a live or perfectly simultaneous market snapshot.
The accompanying briefing described borrowing costs reaching levels last seen many years earlier. The common theme was a higher required return for holding long-dated government debt, with implications extending beyond sovereign issuers to households, companies and the valuation of other assets.
Evidence and Context
The chart labels the US and French levels as the highest since 2002, the UK since 2007, Germany since 2011 and Japan since 1996. These historical comparisons are reproduced as the reference chart’s claims; they have not been reconstructed from the underlying daily yield series.
The reference linked the rise to persistent inflation pressure, oil above $100, expectations of further central-bank tightening and country-specific fiscal concerns. It described a particularly large third-quarter yield increase in the United States and France. A government’s financing outlook can influence its term premium even when the expected timing of the next policy move changes.
Local factors differed. The briefing associated France’s wider spread over Germany with deficit concerns, cited a UK thirty-year yield above 6% ahead of a difficult budget, and linked Japan’s move to monetary tightening and heavier public spending. Those thirty-year observations provide context and are distinct from the ten-year series shown in the chart.
The analysis also noted that softer US inflation data had reduced the perceived chance of another immediate Federal Reserve increase without reversing pressure at the long end. The reference used that divergence to separate policy expectations from concerns about inflation persistence, debt supply and the compensation investors require over a longer holding period.
Market Implications
A pause in policy tightening would not automatically remove the premium investors demand for long-term fiscal and inflation uncertainty. For governments with substantial refinancing needs, higher yields can gradually increase interest costs as debt is rolled over.
The effect extends to mortgage financing, corporate borrowing and the discount rates used to value future cash flows. Government bonds with higher yields also change the opportunity cost of holding riskier assets. That does not imply a mechanical fall in every other asset; it raises the return hurdle against which investors assess them.
Across these four chapters, the connecting question is how capital is financed and where it chooses to remain. Policy expectations influence positioning, leverage changes the sensitivity of markets to shocks, and onchain lending shows how deposits and borrowing interact. VALYQOR’s focus is on understanding those relationships between digital markets, derivatives and financial infrastructure.