
Bitcoin Amid Broader Market Pressure
Relative performance is a starting point, not a conclusion.
Understanding digital markets starts with connecting the evidence. This VALYQOR explainer brings together cross-asset performance, spot demand, leveraged exposure, onchain liquidity and volatility.
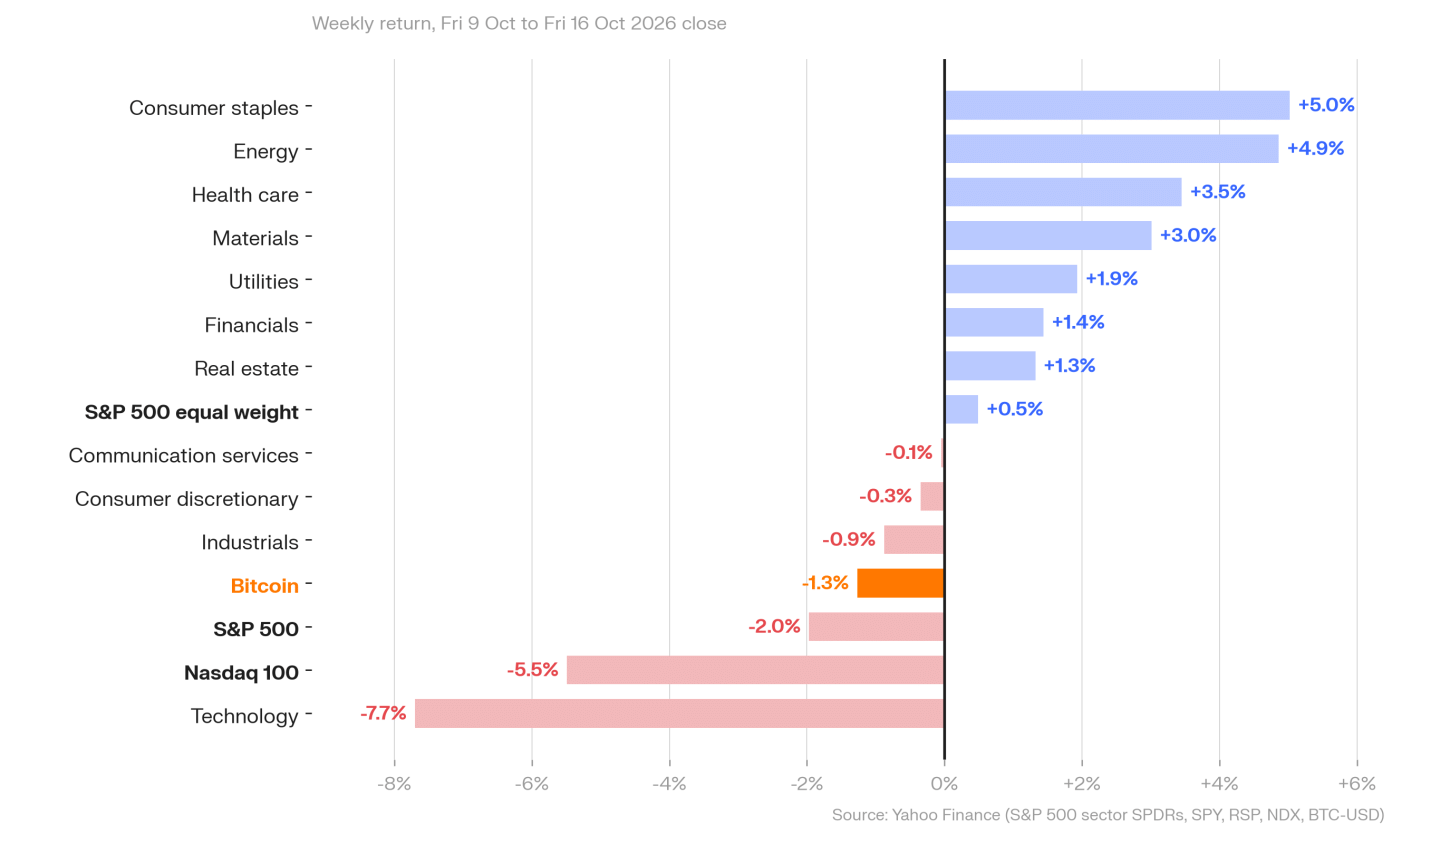
Key Observation
Bitcoin can respond differently from equities during the same period of uncertainty. Comparing those moves helps frame a question: is the pressure specific to one market, or is it part of a broader change in risk appetite? A smaller decline does not, by itself, establish resilience.
The comparison needs a common observation window. Crypto trades continuously, while equity markets have opening hours, holidays and closing auctions. A weekend move and a Friday close cannot be treated as equivalent observations without explaining the timing.
Supporting Evidence
Start with returns measured over the same interval, then examine trading volume, order-book depth and the breadth of the move. Distinguish a price move supported by broad participation from a move occurring in thin liquidity.
Macro releases, rates and sector-specific developments can provide context, but a nearby headline is not proof of causation. Use documented event times and separate contemporaneous observations from interpretations.
Market Implications
Read relative strength alongside participation. When Bitcoin holds up while other risk assets weaken, the next question is whether spot demand and market depth support that difference.
For VALYQOR, this is a research framework for comparing signals across digital markets. It is not a forecast or a claim that a particular relationship will persist.
Spot Demand and Leveraged Exposure
Separate demand for the asset from demand for exposure.
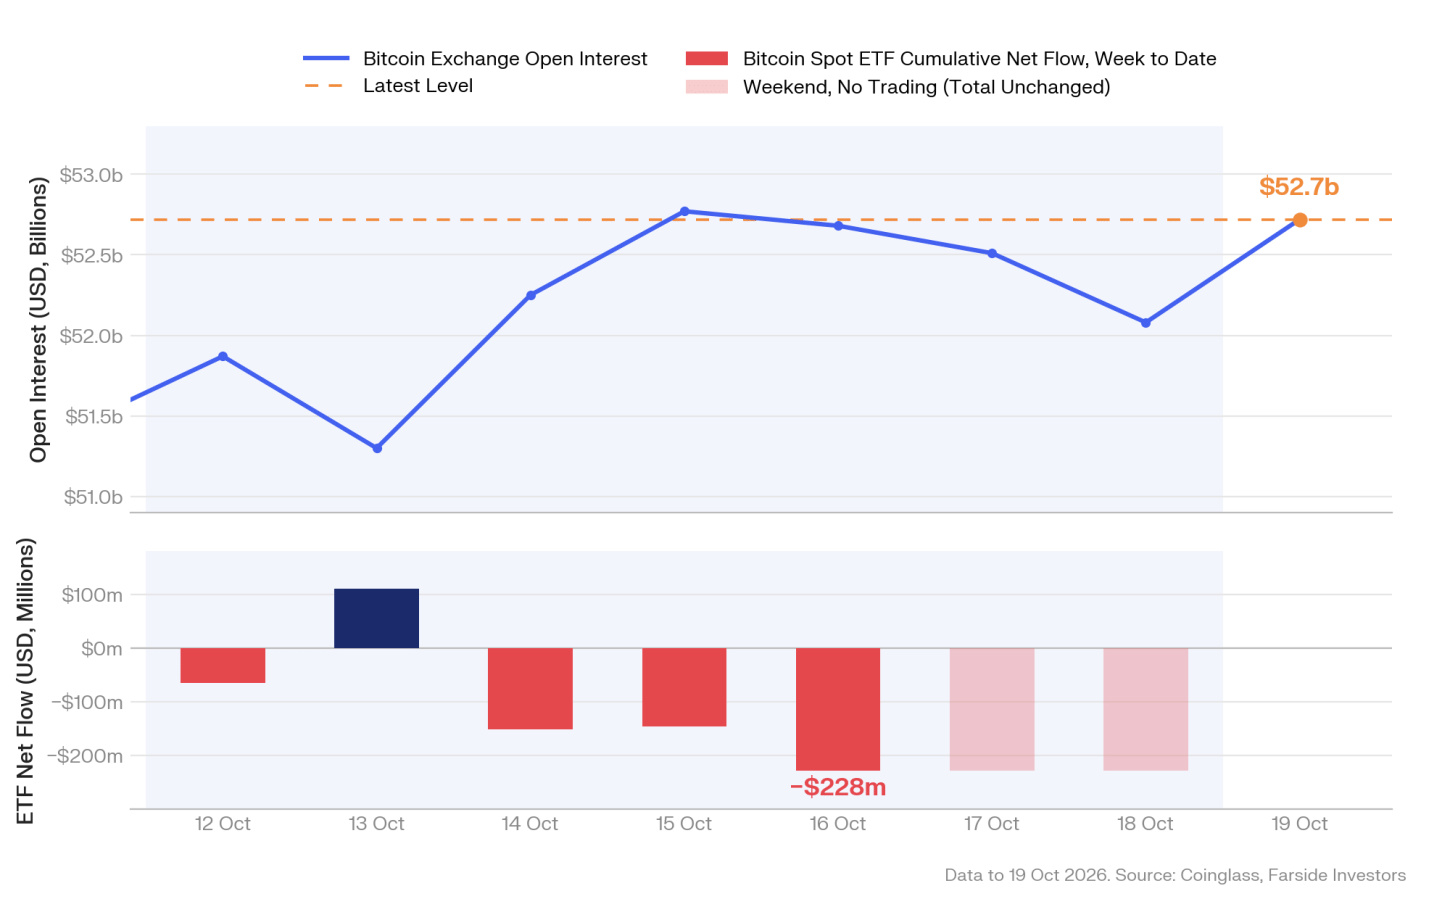
Key Observation
Spot activity and derivatives positioning describe different parts of a market. Spot purchases involve an exchange of the underlying asset; futures and perpetual contracts can change exposure without the same transaction in the spot market.
A market can therefore show subdued spot participation alongside substantial derivatives activity. Reading the two together is more informative than treating a rise in open interest as evidence of new long-term investment.
Supporting Evidence
Compare net fund flows, spot volumes and order-book conditions with open interest, futures basis and perpetual funding. Record the venue, quote currency, contract type and observation time for each series.
Open interest counts outstanding contracts, not a net bullish position: each contract has counterparties. Dollar-denominated open interest may also change because the underlying price moves. Funding reflects a contract mechanism and varies by venue and interval.
Fund flows capture a specific product universe rather than the whole spot market. Avoid adding unlike measures together or presenting a single venue as a complete picture of global activity.
Market Implications
If leveraged exposure expands while spot participation remains limited, examine the conditions under which positions could be reduced. Margin rules, collateral quality and available depth matter alongside the headline exposure.
This combination can motivate a closer look at fragility, but it does not establish that liquidations will occur. State the assumptions and the observations that would contradict the interpretation.
Liquidity Waiting on the Sidelines
Available capital and deployed risk are different things.
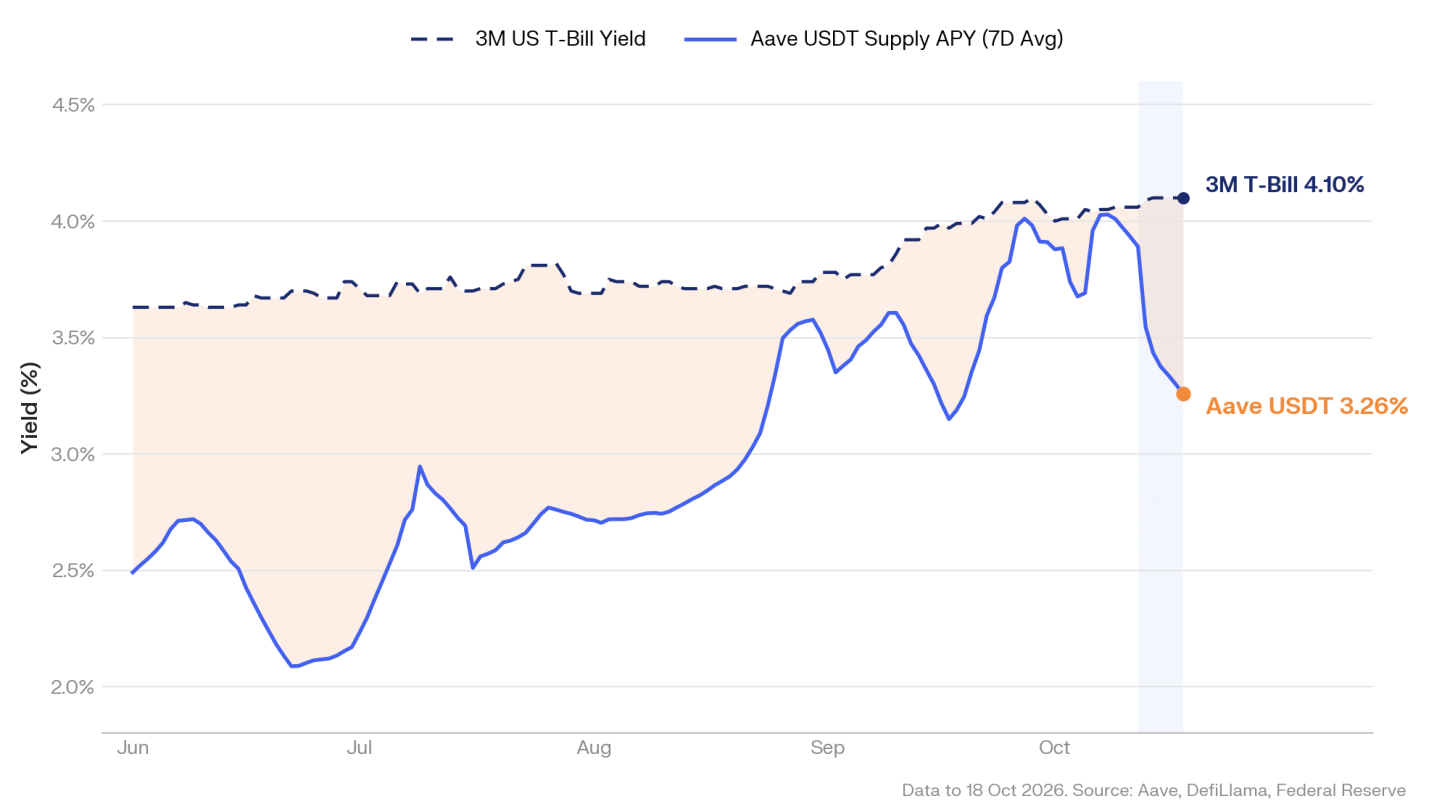
Key Observation
Stablecoin balances, lending deposits and bridge flows can reveal where funds are held or transferred. They do not automatically show an intention to buy risk assets. Capital can remain available while participants wait, manage collateral or meet operational needs.
Changes in lending yields need similar care. A supply rate can fall as deposits grow, as borrowing falls, or as parameters change. The rate alone cannot identify which mechanism is responsible.
Supporting Evidence
Read deposits alongside borrowing, utilisation, incentives and protocol parameters. Distinguish token quantities from their dollar value, and distinguish gross transfers from net flows.
A comparison between onchain lending yields and Treasury yields must state its assumptions. The instruments differ in liquidity, maturity, access, counterparty exposure and technical risk; a yield gap is not a like-for-like measure of value.
Cross-chain movements can include the same capital leaving one system and returning through another. Check bridge mechanics and aggregation methods before counting those movements as separate inflows.
Market Implications
More stablecoin liquidity may increase capacity for future activity without confirming that activity has begun. A useful follow-up is whether borrowing, settlement and spot participation change alongside the balances.
Look for consistent evidence across several measures, and describe alternative explanations. Avoid converting an observation about available liquidity into a claim about assured future demand.
Bitcoin Volatility in Context
Compare uncertainty with consistent definitions.
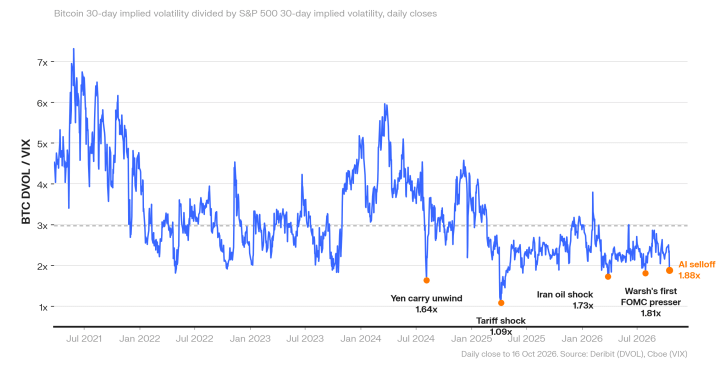
Key Observation
Options-implied volatility describes uncertainty embedded in option prices. Realised volatility describes variation in observed returns. Both can help contextualise market conditions, but they answer different questions.
Comparing Bitcoin volatility with equity volatility adds another layer: the markets have different trading hours, participants, index methods and event exposures. A low ratio is an observation, not a direction signal.
Supporting Evidence
Align the tenor and timestamp of the measures before calculating a ratio. Record index methodology and distinguish an implied-versus-implied comparison from one involving realised volatility.
When a ratio changes, inspect both its numerator and denominator. A falling Bitcoin-to-equity volatility ratio could reflect lower Bitcoin volatility, higher equity volatility, or both. Those scenarios have different interpretations.
Historical comparisons require consistent data and a stated sample. Percentiles, medians and event annotations should be calculated from the documented series rather than inferred from a chart.
Market Implications
A divergence between volatility measures can frame further research into how markets price uncertainty. It cannot establish that one market must catch up with the other.
Keep the context in view. Combine volatility with spot participation, leverage and liquidity, then revisit the interpretation as new evidence arrives. A disciplined process explains both what the evidence suggests and what it cannot establish.