
When Equities Weaken, Bitcoin Holds Firmer
A week of sharp sector rotation put headline prices in a different light.
Historical market review · October 2026
An analysis of the supplied dated charts and reference commentary, covering cross-asset performance, derivatives, onchain liquidity and options. These observations are not a live market feed.
Market Overview
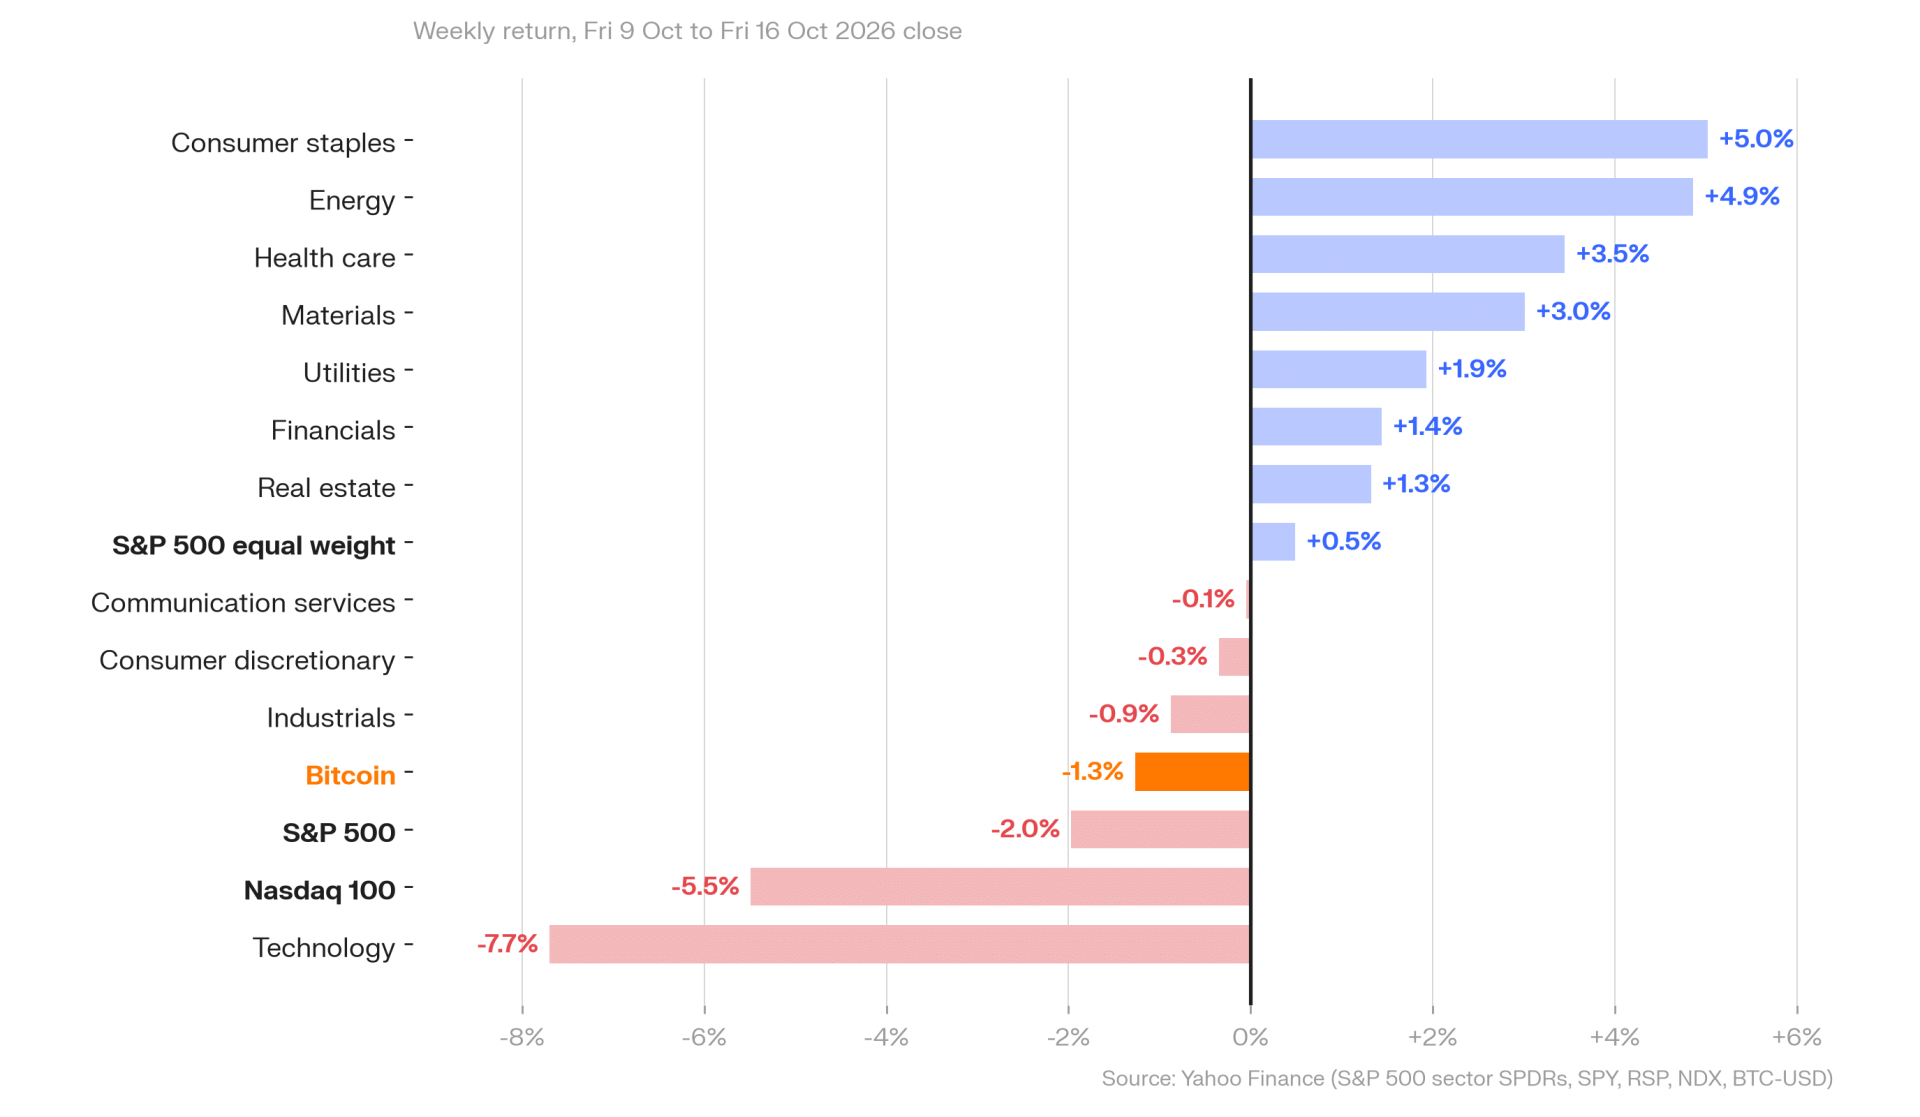
The supplied October 2026 market snapshot shows an uneven retreat across risk assets. For the common Friday-to-Friday window of 9–16 October, Bitcoin fell 1.3%, compared with a 2.0% decline in the S&P 500 and a 5.5% fall in the Nasdaq 100. Technology lost 7.7%. Bitcoin declined, but the scale of its move was materially smaller than the pressure on technology shares.
That distinction matters. A falling headline index can suggest that investors are withdrawing from everything. Here, seven of the eleven equity sectors finished higher, and the equal-weight S&P 500 gained 0.5%. The evidence points to a substantial rotation within equities, alongside weakness in the largest growth-sensitive exposures.
Evidence and Context
Consumer staples led the chart at +5.0%, followed by energy at +4.9%, health care at +3.5% and materials at +3.0%. Utilities, financials and real estate also advanced. In contrast, communication services, consumer discretionary and industrials recorded smaller declines. The contrast between the equal-weight index and its capitalisation-weighted counterpart is central to understanding the week.
The accompanying reference commentary connects the technology sell-off with concerns about AI-related valuations, financing and growth expectations, against a backdrop of inflation uncertainty. The chart itself establishes the return pattern; it does not isolate which news item caused each move. Sector concentration and changing expectations can amplify an index decline even when participation elsewhere remains comparatively firm.
Bitcoin’s 1.3% decline in this chart uses the stated 9–16 October closing window. The roughly 2% move mentioned elsewhere in the reference material is not reconciled to that same window. This review keeps the chart’s 1.3% figure for the cross-asset comparison rather than mixing the two windows.
What This May Indicate
The first question is whether weakness remains concentrated or spreads into broader risk reduction. Continued strength in defensive and non-technology sectors would support the rotation interpretation. Deteriorating breadth, weaker market depth and sustained selling across unrelated assets would point to a different environment.
Bitcoin’s relative performance is therefore worth watching, but it is not evidence of permanent independence from equities. A smaller decline can coexist with weak spot demand. The next step is to examine whether fresh cash supports the market, or whether leveraged positioning is doing more of the work.
Spot Capital Retreats, Leverage Persists
Fund outflows and outstanding derivatives exposure tell different stories.
Market Overview
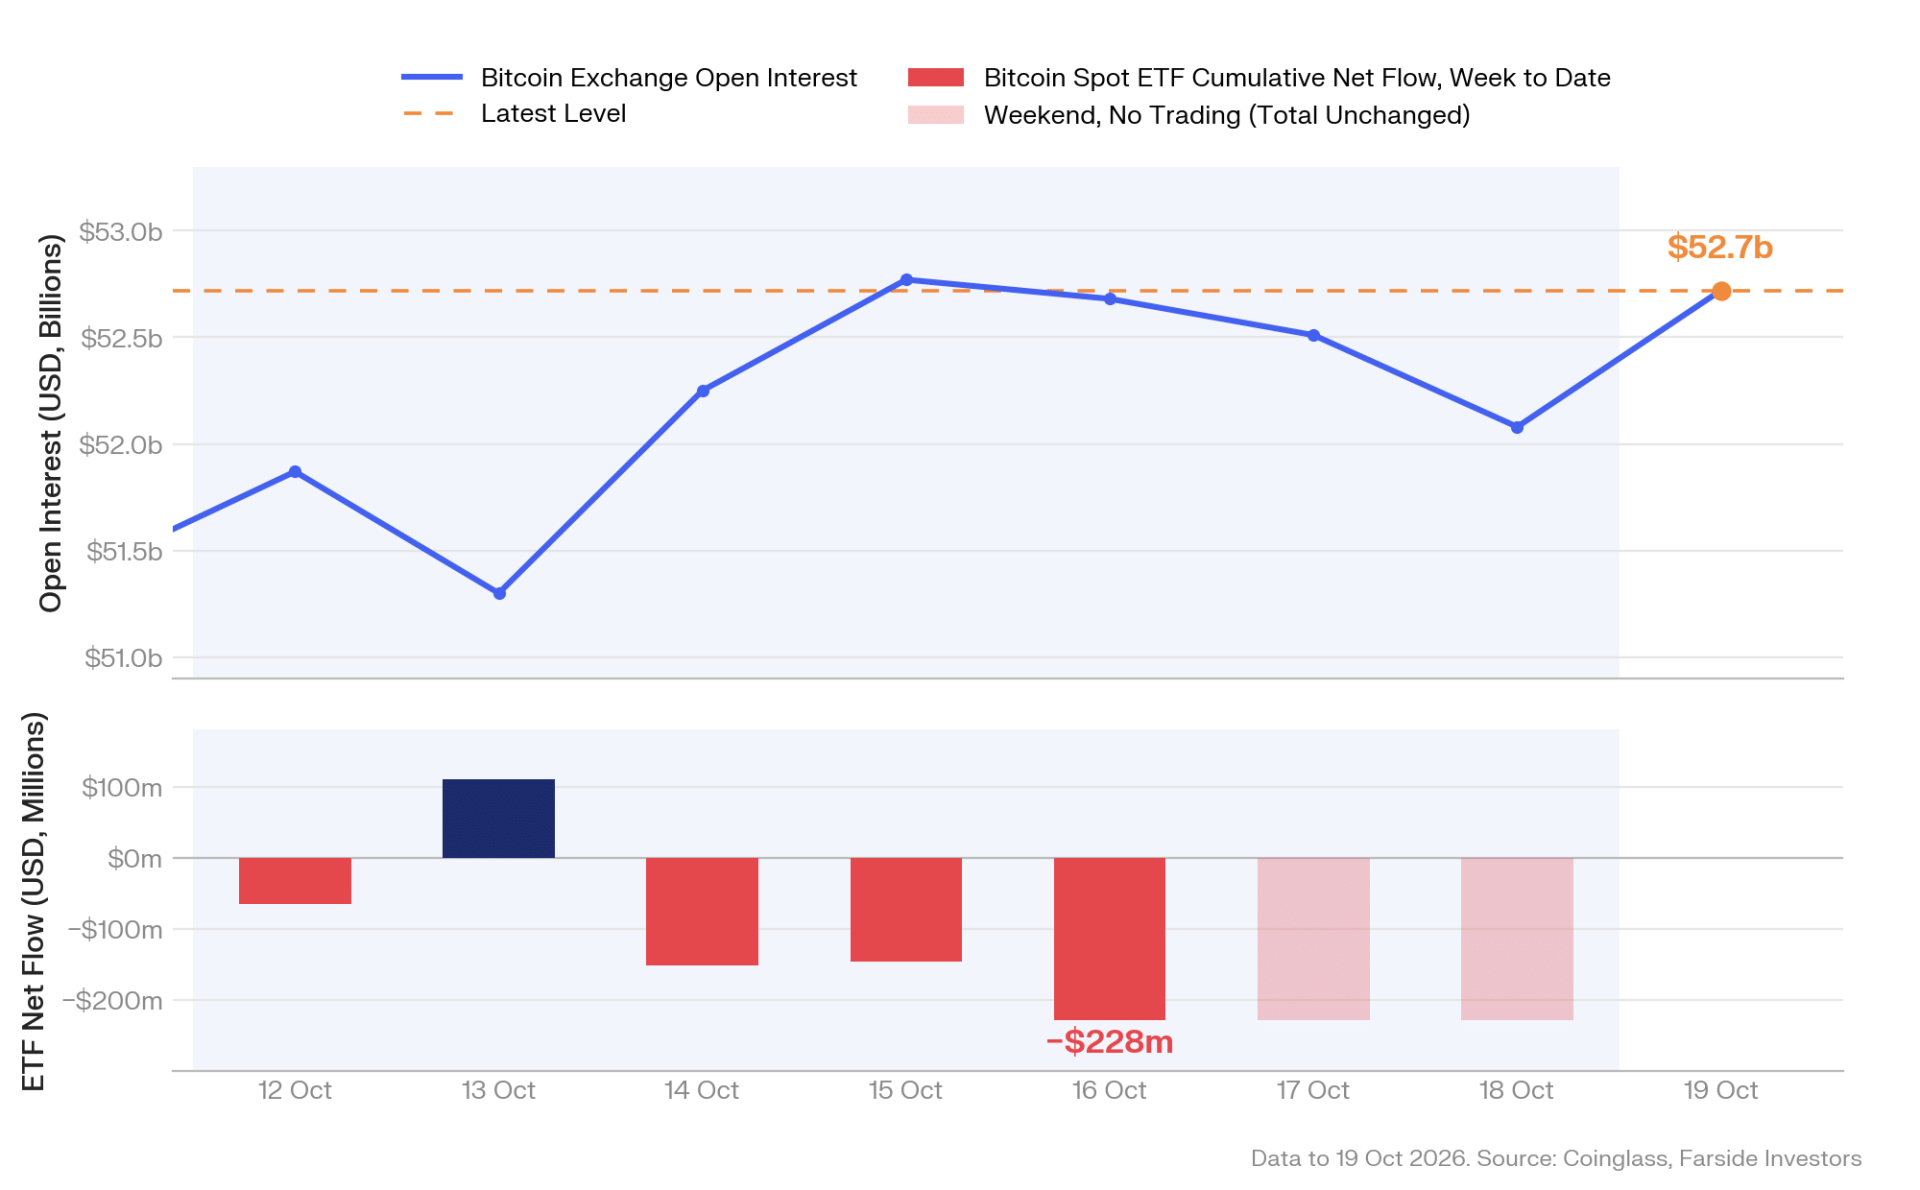
The second chart places two measures side by side: cumulative US spot Bitcoin ETF flows and exchange open interest. ETF flows accumulate to approximately −$228 million by 16 October, while open interest recovers from a mid-period low to $52.7 billion at the 19 October endpoint. Capital leaving one spot-investment channel did not coincide with a sustained collapse in derivatives exposure.
The divergence deserves attention because headline price stability can conceal a change in the composition of market participation. Exposure may be maintained or rebuilt through derivatives even as cash-funded investment products experience redemptions. That does not make every outstanding contract a bullish position, but it changes the questions to ask about collateral and liquidity.
Evidence and Context
Open interest reaches approximately $51.3 billion around 13 October before recovering. The supplied reference text gives a separate weekly snapshot of $52.1 billion; the uploaded chart extends through 19 October and labels its final observation $52.7 billion. The reference material does not reconcile those readings, so the explicitly dated chart endpoint is used here.
The ETF line is cumulative within the displayed period. A flat line over the weekend does not represent a fresh daily outflow: it carries forward the last available trading-session total. Likewise, fund flows cover the ETF universe shown, not all global Bitcoin spot transactions.
The reference commentary also describes firmer funding and liquidation pressure around macroeconomic releases. Those details provide context for the leverage discussion, but neither funding nor liquidations is plotted in this figure. Open interest alone cannot establish who initiated a trade, whether exposure is hedged, or whether the positions are predominantly directional.
Dollar-denominated open interest can also change when Bitcoin’s price changes. A fuller assessment would compare contract quantities, venue coverage, funding, basis and available spot depth on consistent timestamps. A rise in the dollar series is not automatically an equivalent amount of new investment capital.
What This May Indicate
When ETF demand weakens while derivatives exposure recovers, the market may become more dependent on positions that can be reduced quickly. If funding remains expensive and prices decline, margin pressure can accelerate that reduction. This is a conditional vulnerability, not a prediction that forced selling must follow.
The stronger confirmation would be a combination of sustained spot inflows, improved execution depth and less stretched funding. Conversely, continued redemptions alongside rising leverage would justify closer attention to liquidity around economic releases. The distinction is between durable participation and exposure that depends on favourable financing conditions.
Onchain Capital Remains on Standby
More available liquidity does not necessarily mean more risk is being taken.
Market Overview
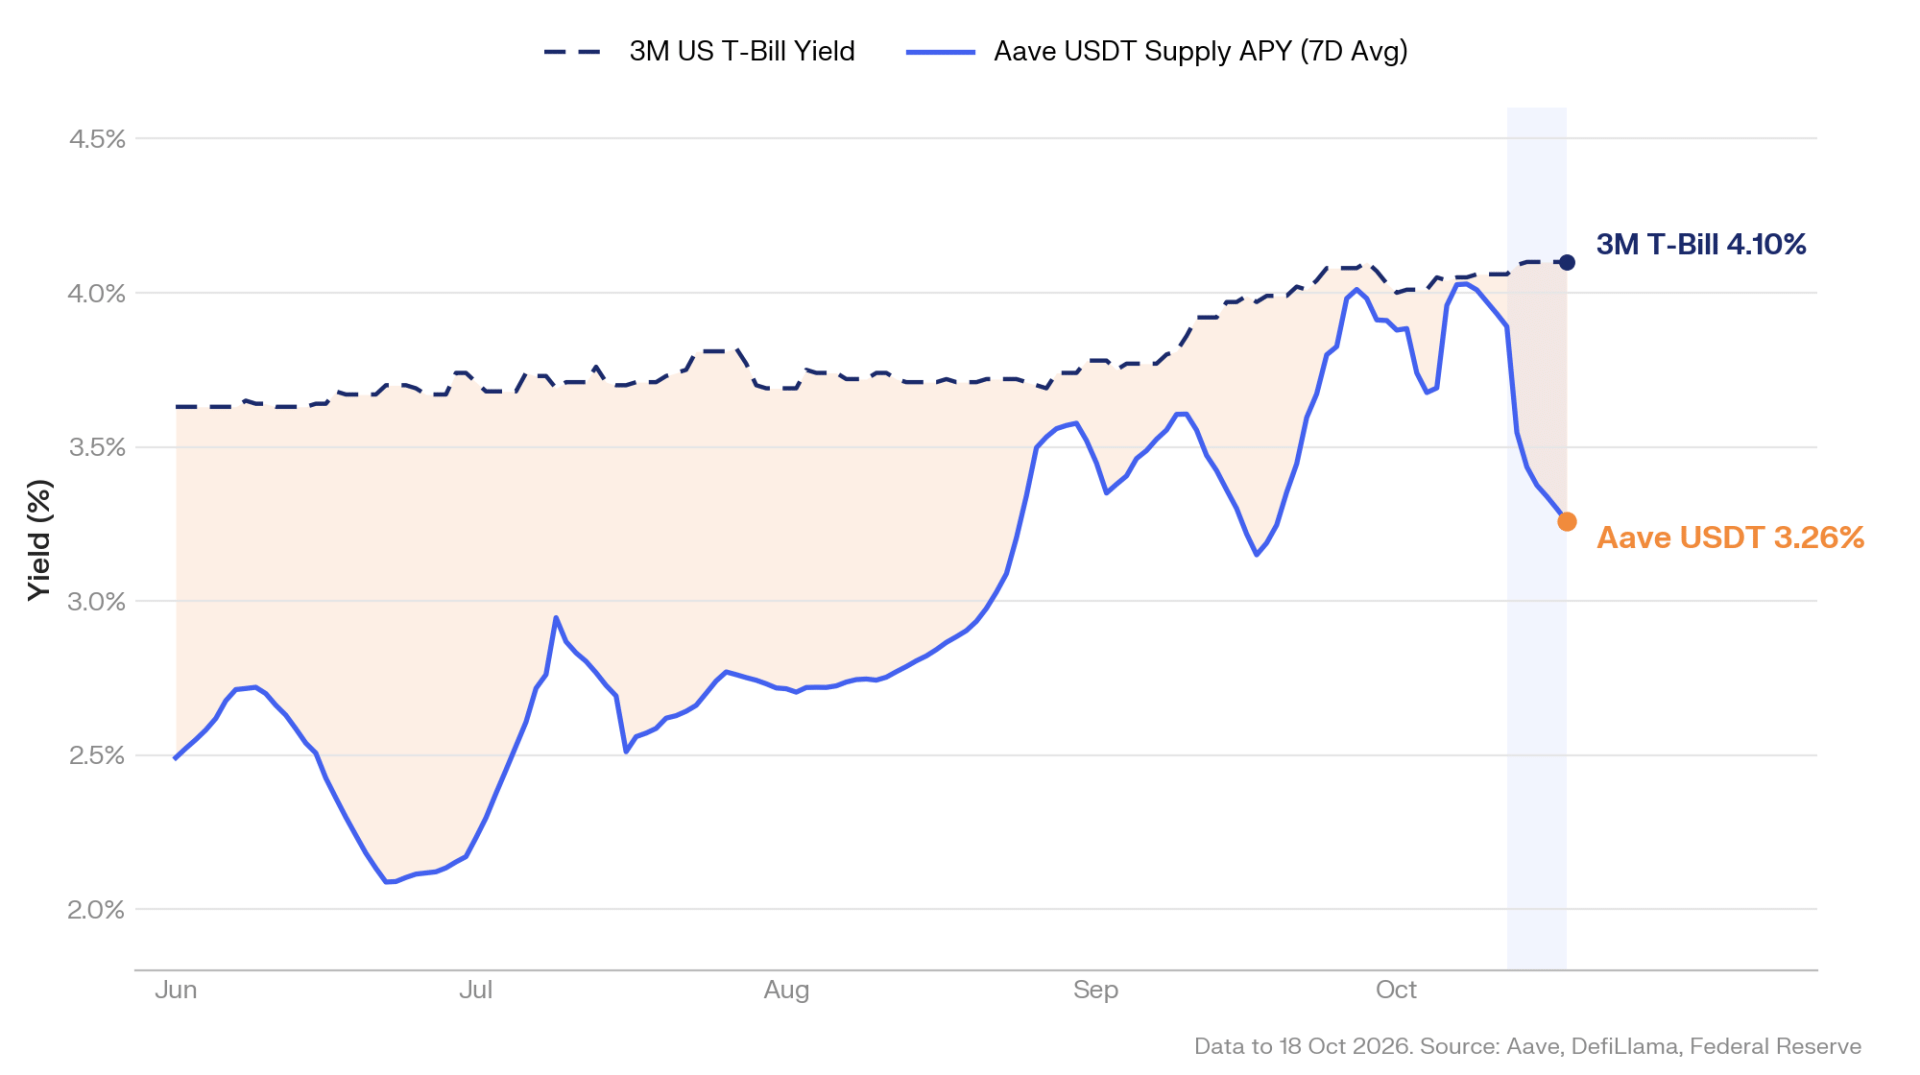
The third chart compares the seven-day average Aave USDT supply APY with the three-month US Treasury bill yield. At the 18 October endpoint, the displayed values are 3.26% and 4.10%, respectively: an 84-basis-point gap. The onchain supply rate sits below the Treasury benchmark even though the reference commentary describes an increase in USDT deposits.
The reference snapshot reports USDT supply rising by roughly 6%, from about $2.73 billion to $2.89 billion, as utilisation declined. Taken together, those observations describe capital becoming available to the lending market faster than borrowing demand absorbs it. They do not establish that the same capital is about to move into spot assets.
Evidence and Context
The distinction between an instantaneous lending rate and a moving average is important. The reference text cites a 3.14% point-in-time supply APY; the chart shows a seven-day average of 3.26%. The 84-basis-point comparison in this article is calculated from the plotted average and the 4.10% Treasury yield, not from the point-in-time rate.
The wider reference discussion describes withdrawals from some trading venues, shifts between chains and different deposit trends across stablecoins. Such movements can be consistent with a preference for liquidity, but there are other explanations: collateral management, repayments, settlement needs and changes in incentives can all alter where funds are held.
Bridge flows require particular care. Capital leaving a venue and returning through another network can appear in several transfer series without representing several independent investment decisions. Similarly, changes in the dollar value of ETH or Bitcoin collateral can partly reflect price movements rather than token withdrawals.
Onchain lending and Treasury bills are not interchangeable instruments. Access, settlement, maturity, smart-contract exposure and counterparty arrangements differ. The yield comparison describes pricing conditions in the supplied snapshot; it is not a risk-adjusted ranking or a recommendation to move funds between the two.
What This May Indicate
A lower supply yield alongside higher deposits is consistent with readily available capital and limited immediate borrowing demand. The useful follow-up is whether utilisation, borrowing and actual trading activity begin to rise together. Until then, liquidity on standby should not be treated as confirmed buying pressure.
Changes in collateral needs or scheduled repayments could keep supply rates subdued even with sizeable balances in place. A shift toward risk-taking would be more persuasive if deposit growth were accompanied by stronger settlement activity, wider participation and sustained spot demand. Available capacity and deployed risk remain distinct.
Bitcoin Options Reflect a Different Risk Outlook
Equity uncertainty rose more sharply than the uncertainty priced into Bitcoin options.
Market Overview
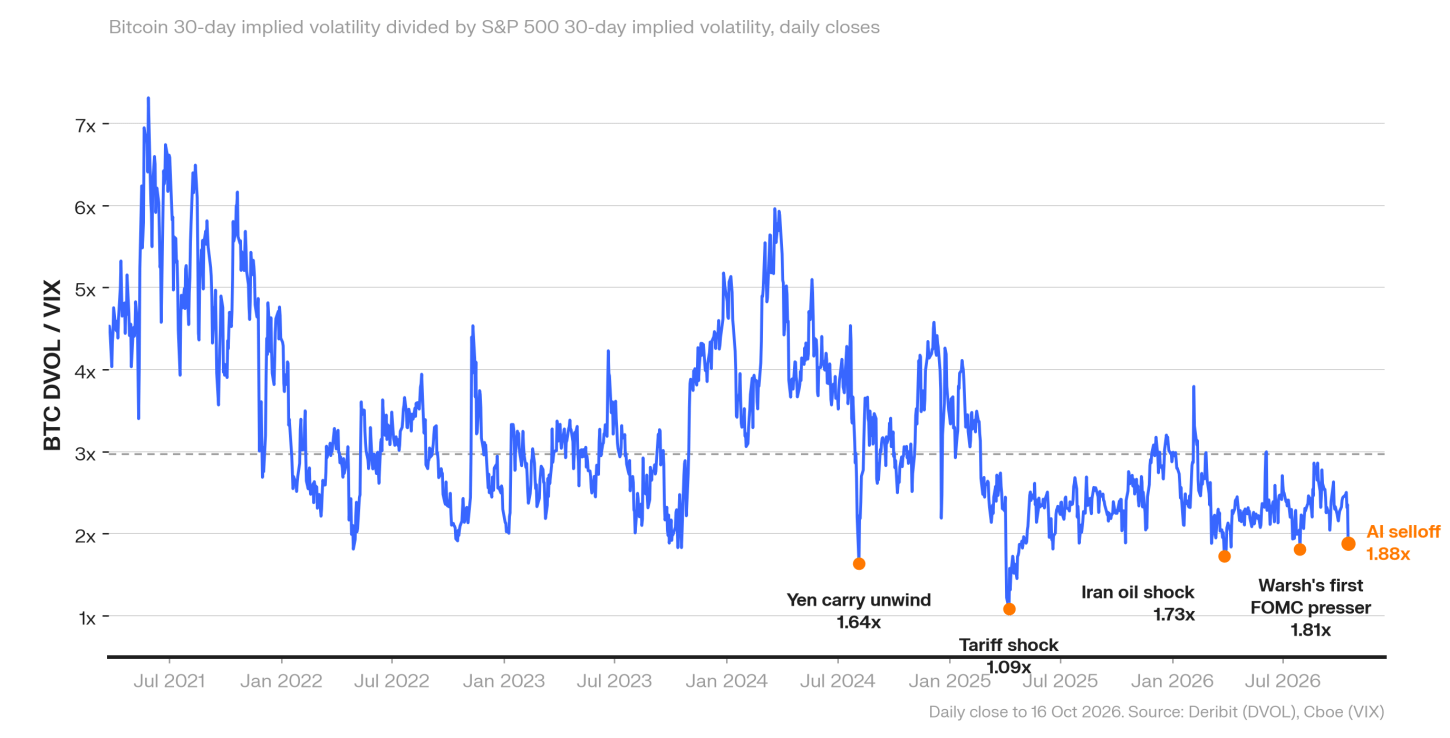
The final chart compares Bitcoin implied volatility, represented by DVOL, with equity implied volatility, represented by VIX. Its latest labelled ratio is 1.88 on 16 October 2026. The accompanying snapshot gives Bitcoin DVOL of approximately 37.7 and VIX of approximately 20.0, consistent with that ratio.
A low reading means that Bitcoin implied volatility is low relative to equity implied volatility within this comparison. It does not mean Bitcoin has become a low-risk asset, nor does it indicate which direction its price will move. It shows that the two options markets were pricing uncertainty differently.
Evidence and Context
The chart spans daily closes from 2021 through October 2026 and highlights several earlier periods of compression. The reference discussion associates those episodes with shocks in equities and cross-asset positioning. The useful comparison is how the numerator and denominator behaved, rather than treating every low ratio as the same trading signal.
The reference narrative characterises Bitcoin volatility as subdued relative to its own history, while equity implied volatility included a larger premium over recent realised volatility. That interpretation is consistent with different expectations for future turbulence, but the ratio chart alone does not establish historical percentiles or calculate an implied-versus-realised premium.
A falling ratio can arise because DVOL falls, VIX rises, or both. A subsequent recovery can likewise happen through calmer equity markets or more expensive Bitcoin options. Those paths have very different implications, even if they produce the same ratio. Comparing matched observation times and understanding each index methodology are essential.
What This May Indicate
If equity stress remains concentrated, the gap could narrow as VIX declines without a major change in Bitcoin conditions. If pressure spreads across risk assets, Bitcoin implied volatility could rise instead. The chart provides a way to distinguish those possibilities as new observations arrive; it does not establish that either outcome is inevitable.
The four perspectives belong together. Relative price resilience, ETF withdrawals, persistent leverage and idle onchain capital describe different dimensions of the same market. For VALYQOR, a disciplined research approach means following those connections, separating measured observations from explanations, and revising the interpretation when participation or financing conditions change.